Yield Optimization for Room Rentals: A Practical Guide
August 28, 2026
You can have every room occupied at the start of the month and still miss your profit target. In room-by-room rentals, one vacancy, one poorly timed price change, or one utility bill that gets ignored can take more from NOI than a small rent increase adds. The practical answer is yield optimization, managing each room according to its demand, timing, costs, and resident fit rather than treating the house as one undifferentiated asset.
When One Empty Room Quietly Drains Your Profit
A host I know ran a six-room PadSplit-style house in a mid-size metro. At the beginning of the month, every room was full, so the operating outlook looked strong. On the 9th, a long-stay resident moved out. The room didn't fill until the 24th.
That created 14 vacant nights. The missed rent was only the visible part of the problem. The mortgage or rent payment continued. Property taxes, insurance, internet, security monitoring, and base utility charges didn't pause. The host still had to keep the room ready, answer inquiries, coordinate showings, and absorb the possibility of another maintenance call. Meanwhile, the other five residents continued using shared utilities and common areas, but their payments couldn't fully replace the missing sixth-room revenue.
At a weekly room rate of $250, the vacancy represented roughly $500 of uncollected rent, before considering turnover costs. That simple example shows why a room can erase the profit produced by the rest of the house. The exact loss depends on rent, billing terms, variable expenses, and the speed of the next placement, but the operating principle is consistent: a vacant room is perishable inventory. Once a night passes empty, you can't sell it later.
Operator lesson: Occupancy is not enough. You need to know how quickly each room fills, what price it can support, and what it costs to keep available.
This is the same broad logic behind efforts to improve short-term rental revenue. Hotels and furnished rentals have long treated unsold nights as lost inventory. A shared-housing operator should apply that thinking at the bedroom level, while also accounting for churn, resident fit, cleaning, utilities, and access control.
That wake-up call changed how I reviewed a property. I stopped asking only whether the house was full and started asking whether each room was being priced and managed at the right moment. That is the foundation of yield optimization.
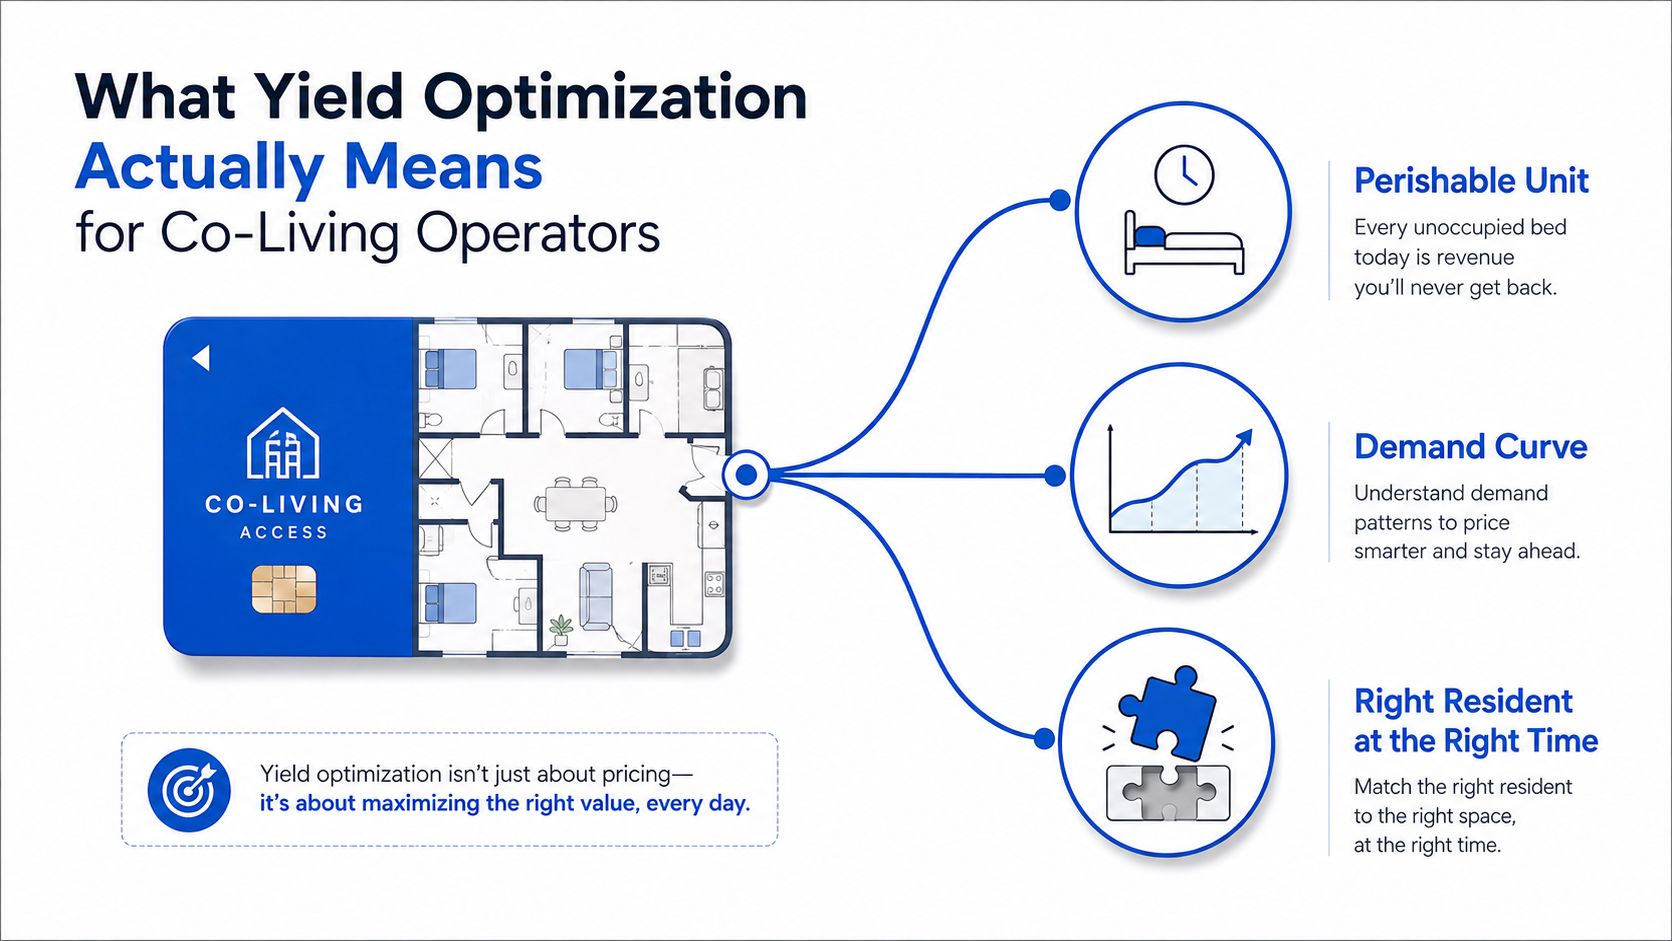
What Yield Optimization Actually Means for Co-Living Operators
Yield management began as a formal discipline in airlines during the 1980s. American Airlines developed the world's first yield management system in 1985, following earlier optimization ideas such as Littlewood's rule in 1972 and the expected marginal seat revenue concept in 1987. The modern playbook combines forecasting, optimization, and reservation controls to maximize revenue from fixed-capacity inventory, a history outlined in this overview of dynamic pricing research.
Hotels later adapted the same logic. A room available tonight can't be stored and sold tomorrow. Operators adjust prices based on demand, purchase timing, available inventory, and customer segment. The hospitality definition is straightforward: sell the right room to the right customer at the right time for the right price, as described in this hotel yield management guide.
For co-living, replace the hotel room with a private bedroom and shared access. The buyer may be a working professional, a shift worker, a relocating resident, or someone who needs flexible housing without a traditional lease. Their buying window may last days rather than hours, but the room still loses value each night it remains empty.
A working definition for operators
I define yield optimization for a shared house this way:
Yield optimization is the recurring process of matching each room's price, availability, resident type, and operating cost to the demand that exists at that point in time.
That definition matters because PadSplit-style operators have relatively few rooms, weekly cash flow, meaningful churn risk, and expenses that don't scale down neatly when one room goes vacant. A hotel might spread an empty room across hundreds of units. A small house can't hide the result as easily.
The discipline also isn't limited to rent. It includes:
- Forecasting demand: Understanding which rooms, dates, and price points attract inquiries.
- Controlling inventory: Deciding when to hold, discount, restrict, or release a room.
- Segmenting residents: Matching price and terms to resident needs without compromising screening or house rules.
- Protecting margin: Tracking utilities, turnover, supplies, platform fees, and avoidable service calls.
Financial decisions still need a return framework. Operators evaluating renovations or other property investments can also evaluate value-add deals with yield on cost, but room-level yield starts with cleaner operating data.
The Five Numbers That Move NOI in a Shared House
Yield optimization becomes useful when it changes the numbers that determine Net Operating Income, or NOI. I don't start with a pricing tool. I start with a scorecard that shows whether the house earns more, fills more consistently, retains suitable residents, and controls the cost of every occupied bed.
The five metrics below give operators a practical operating view. The healthy bands are qualitative because a property's market, room size, utilities, furnishing level, and resident profile all affect the right target.
| Metric | Operator Definition | Formula | Healthy Band |
|---|---|---|---|
| NOI | Income remaining after operating expenses, before debt service and income taxes | Operating revenue minus operating expenses | Positive and improving |
| RevPAR per room | Revenue efficiency across every room, including vacant rooms | Weekly rent × rooms actually billed ÷ total room count | Rising without damaging retention |
| Occupancy rate | Share of available room nights or billing periods that produce revenue | Occupied room nights ÷ available room nights | Consistently strong, not just high in one month |
| Churn rate | How quickly residents leave at different stages of the stay | Departures during period ÷ resident base during period | Stable or declining at 30, 60, and 90 days |
| Operating cost per bed | Direct and shared operating cost allocated to each bed | Utilities, cleaning, supplies, fees, and service costs ÷ available beds | Stable or declining as revenue grows |
NOI is the headline
NOI is the number that tells you whether your operating decisions work together. Track rental income, approved fees, recurring charges, utilities, cleaning, repairs, supplies, platform fees, and other operating expenses consistently. A rent increase that raises revenue but causes more turnover or unpaid balances may not improve NOI.
For a clean calculation structure, use this guide to calculating net operating income. Keep debt service separate so you can compare the property's operating performance without mixing financing decisions into day-to-day management.
RevPAR exposes hidden vacancies
Hotels use Revenue per Available Room, or RevPAR, to combine price and occupancy. The same lens works for weekly room rentals. Multiply weekly rent by the number of rooms billed, then divide by the total room count. A house with a high average room rate can still have weak room economics if one or two rooms sit empty for long stretches.
Occupancy must show timing
Monthly occupancy can hide a painful gap between move-out and move-in. Track occupancy by week and by source channel. A room that fills quickly through one channel may justify a different listing strategy from a room that generates inquiries but few completed applications.
Churn reveals fit
Track departures at 30, 60, and 90 days. Early churn may indicate a mismatch between listing expectations, house rules, room quality, price, or resident screening. Lowering price can fill a room faster while worsening fit, so churn should sit beside occupancy in every review.
Cost per bed catches leakage
Utilities, turnover cleaning, supplies, maintenance visits, and platform fees can rise while revenue appears stable. Allocate those expenses per bed, then examine which property systems create avoidable usage. Cost control isn't glamorous, but it often produces more durable NOI improvement than a short-lived rent increase.
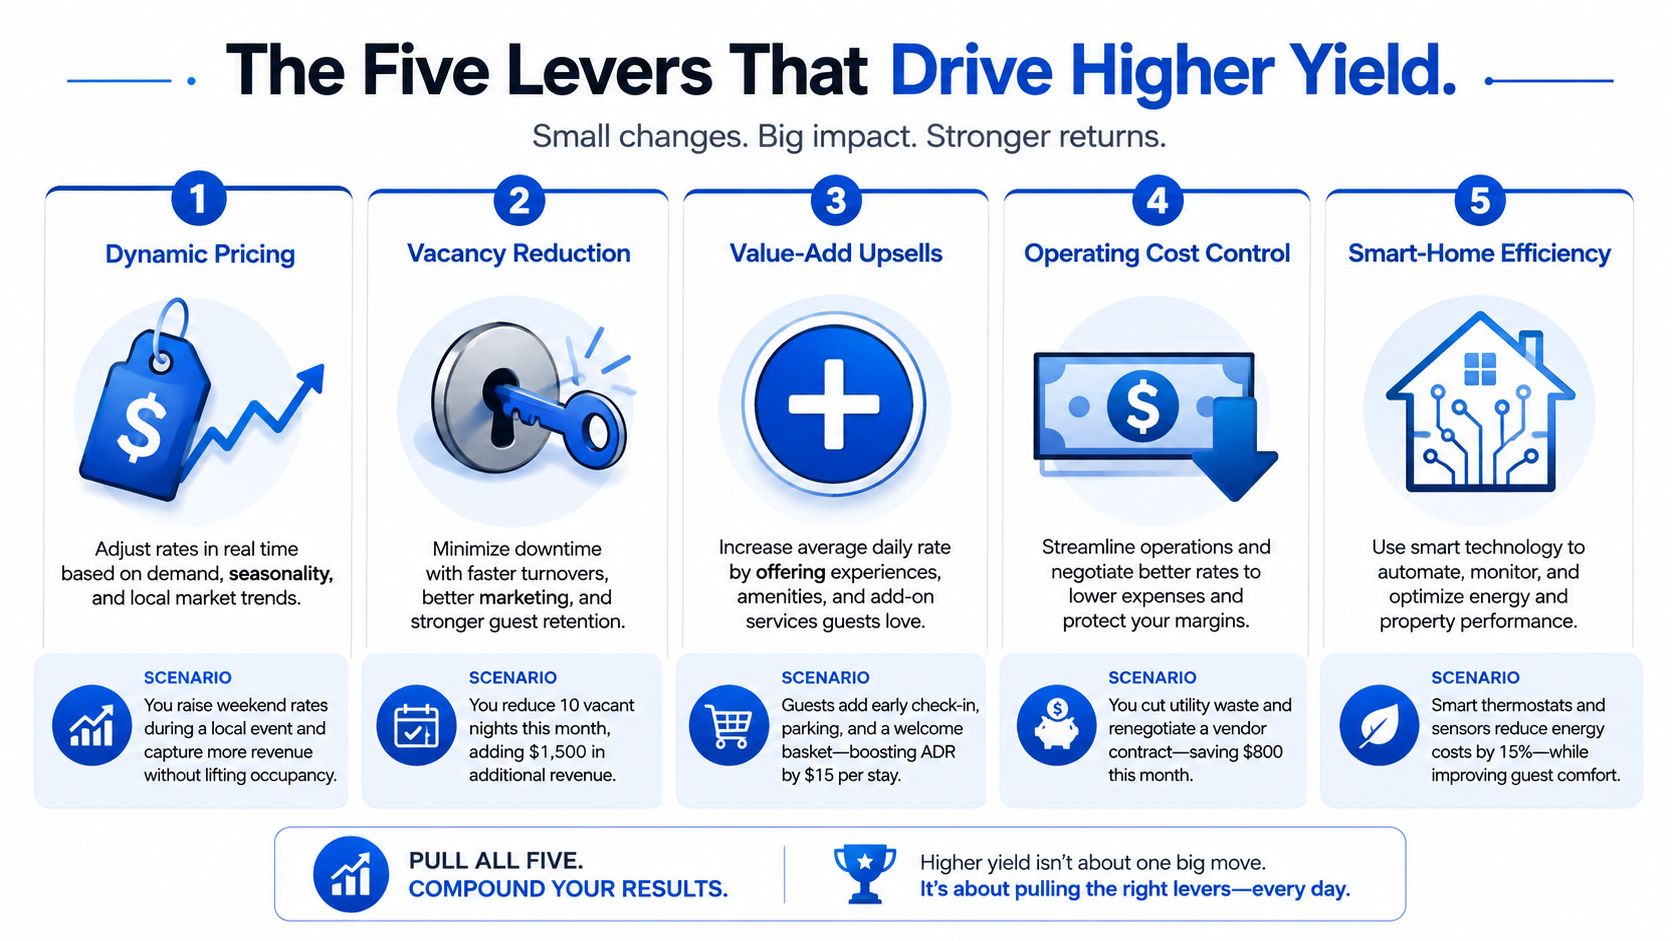
The Five Levers That Drive Higher Yield
The right lever depends on the constraint in front of you. A slow-demand week calls for a different response than a utility spike or a churn problem. Operators lose money when they apply the same tactic to every problem.
Dynamic room pricing
Dynamic pricing is strongest when demand changes faster than your standard rate sheet. If inquiries drop during a slow week, a targeted price adjustment on one room may produce a faster response than cutting every room's price. If applications arrive quickly and several rooms are already occupied, holding the old rate may leave money on the table.
Use predefined occupancy thresholds as operating triggers rather than relying on memory. One documented hotel pricing example raises rates at 75% occupancy by 10%, then adds 15% at 85% occupancy, with another 20% increase possible at higher occupancy. Those thresholds are an example, not a universal rule, and room-by-room housing requires local testing. The useful idea is to set the rule before emotion enters the decision.
Vacancy reduction
Vacancy reduction moves revenue most directly when the room is marketable but poorly distributed. Improve listing photos, clarify eligibility, respond quickly, and remove friction from scheduling. Don't discount a room that has a resident-fit problem or a maintenance issue. More inquiries won't help if applicants reject the room after viewing it.
Value-add upsells
Upsells work when residents already value the underlying service. A paid linen refresh, reserved parking, storage, or a furnished upgrade can add revenue without changing base rent. The offer must be easy to explain and operationally simple. If fulfillment creates extra labor or disputes, the apparent margin can disappear.
For broader margin discipline, these tips to improve profit margins are useful beyond housing. The same principle applies here: measure the contribution after delivery, not just the selling price.
Operating cost control
Cost control wins during expense spikes. Audit cleaning frequency, supply purchasing, maintenance dispatches, and recurring subscriptions before searching for another revenue source. Revenue management also includes overbooking policies, booking restrictions, minimum stays, and closed-to-arrival rules, all of which can reduce leakage from poorly timed stays, as explained in this hotel rate management resource.
Smart-home efficiency
Smart thermostats, leak sensors, occupancy-aware settings, and keyless access can reduce avoidable service calls and utility waste. They matter most when the property has unexplained usage, repeated HVAC complaints, or water-risk exposure. During a utility spike, smart-home efficiency may outperform an upsell because it improves the cost side of NOI without asking residents to buy something extra.
Use competitive pricing intelligence for rental operators to inform rate decisions, but don't let comparable rents override resident fit or property condition. These levers are substitutable in the short term. Over a longer operating cycle, they compound when pricing, vacancy, retention, revenue add-ons, and cost controls reinforce one another.
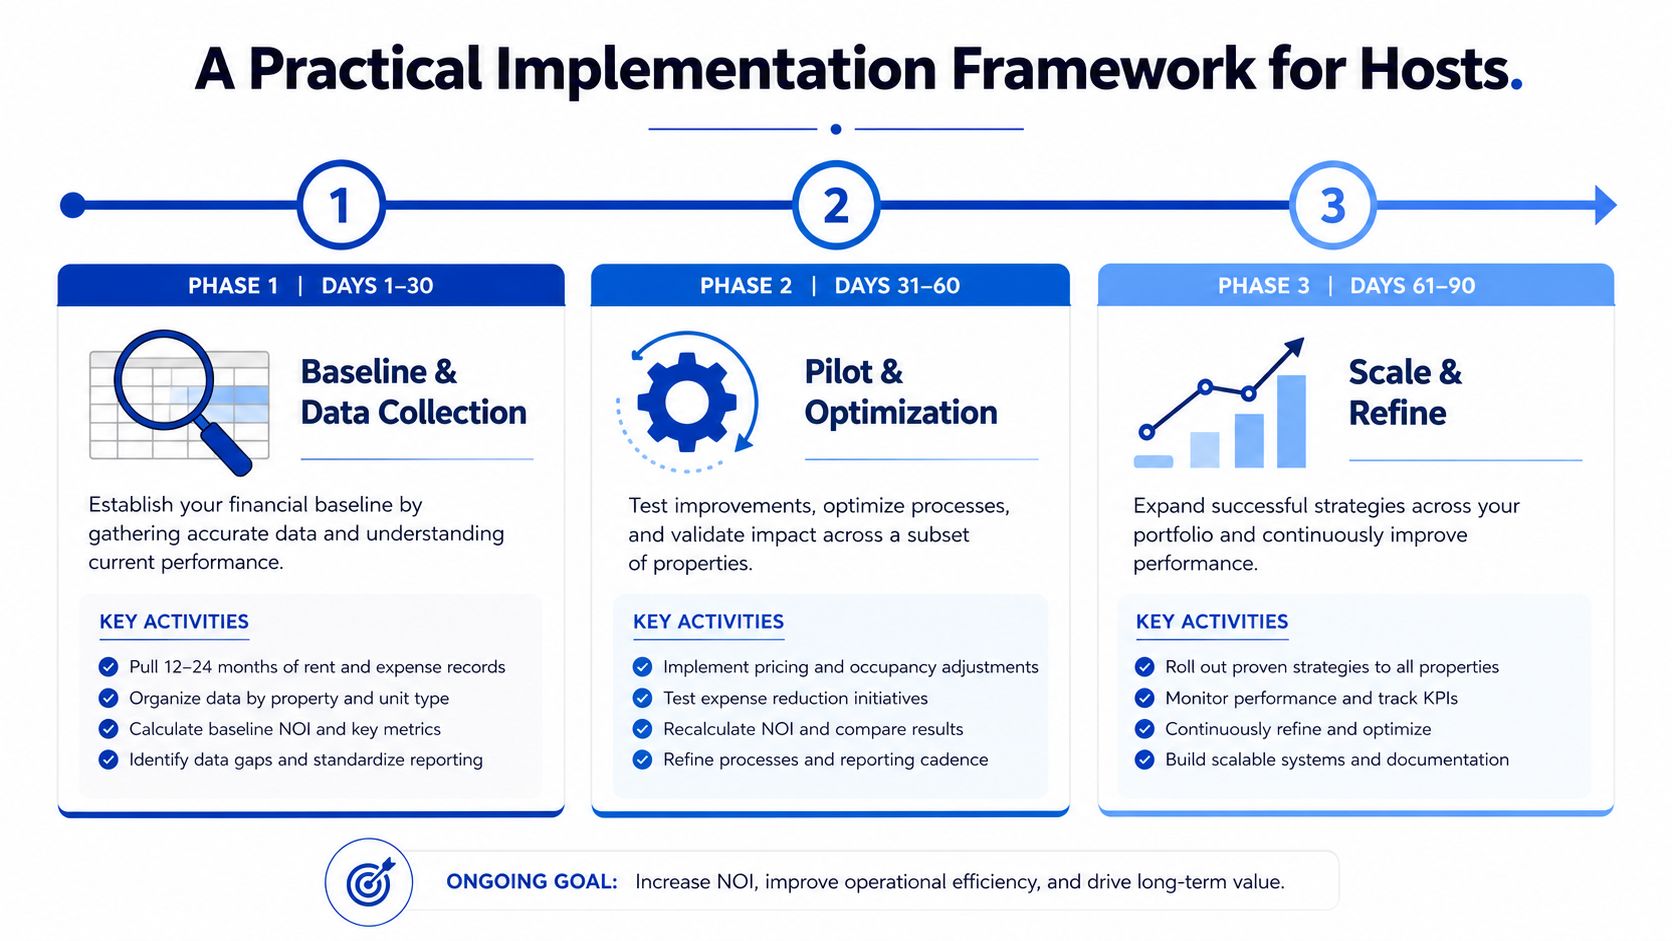
A Practical Implementation Framework for Hosts
The safest rollout starts with measurement, not a dramatic price change. A host needs to know whether a result came from pricing, seasonality, a listing improvement, a resident departure, or a cost event.
Days 1 through 30 for baseline and collection
Pull three months of records before changing a price. Build one working file with:
- Rent records: Listed rent, collected rent, discounts, fees, move-in dates, move-out dates, and payment timing.
- Occupancy records: Available days, occupied days, vacancy gaps, and the source channel for each completed placement.
- Utility records: Electricity, gas, water, internet, trash, and any unusual bill changes.
- Churn records: Departure date, length of stay, stated reason, unpaid balance, and turnover time.
- Turnover and repair records: Cleaning invoices, supplies, maintenance calls, replacement items, and time to make a room ready.
- NOI inputs: Every operating revenue and expense category used in your monthly financial statement.
Calculate current NOI, RevPAR per room, occupancy, churn at 30, 60, and 90 days, and operating cost per bed. Don't change a rate until you can explain the baseline.
Days 31 through 60 for controlled pilots
Layer in two levers. Dynamic pricing and one cost-control change are a practical pairing because one tests revenue and the other tests margin. If you have multiple similar rooms, pilot the pricing approach on two rooms while keeping the others unchanged long enough to observe inquiry, conversion, occupancy, and churn signals.
Write the hypothesis first. For example, “A lower rate during a slow-demand period should shorten vacancy without increasing early departures.” Define what you'll monitor, what must remain stable, and when you'll stop or reverse the test.
Days 61 through 90 for refinement
Add one upsell only after the base operation is reliable. Then introduce smart-home automation where the records show a real cost or access problem. Finish by setting a monthly review cadence with the same scorecard, so each decision can be compared against a stable baseline.
A Six-Room Case Study in Yield Optimization
Consider this illustrative six-room PadSplit-style house in a mid-tier metro. The property started near break-even, with average occupancy at 78% and operating cost at $42 per bed. Monthly NOI was close to zero. Those figures are a model for decision-making, not a claim about a particular operator or market.
The operator made three changes over 90 days. They introduced weekly dynamic pricing on two rooms, installed smart thermostats and leak sensors, and added a paid linen refresh upsell. The pricing pilot targeted rooms with different demand patterns rather than applying one rate across the entire house.
| Metric | Before (Baseline) | After 90 Days |
|---|---|---|
| Average occupancy | 78% | 92% |
| Operating cost per bed | $42 | $33 |
| Monthly NOI | Near $0 | Healthy positive NOI |
| Dynamic pricing coverage | None | Two rooms |
| Smart-home controls | None | Thermostats and leak sensors |
| Value-add offer | None | Paid linen refresh |
The occupancy change came from a combination of better timing and faster vacancy response, not from discounting every room. The operator watched inquiry volume and room-level fill behavior, then adjusted the pilot rather than assuming the same price would work for all six bedrooms.
The cost reduction came from identifying HVAC and water-use issues, not from cutting necessary maintenance. The linen refresh created a separate revenue opportunity, but it only worked because fulfillment stayed simple and residents understood what they were paying for.
What matters in this example: The operator improved both sides of NOI. Pricing addressed room revenue, while smart-home controls addressed operating cost.
The case also shows why one metric can't carry the analysis. Higher occupancy would have been less valuable if it brought excessive churn or expensive turnover. Lower operating cost would have been less meaningful if the property lost qualified residents. The combined scorecard gave the operator a way to judge whether the changes produced healthier economics rather than a temporary headline improvement.
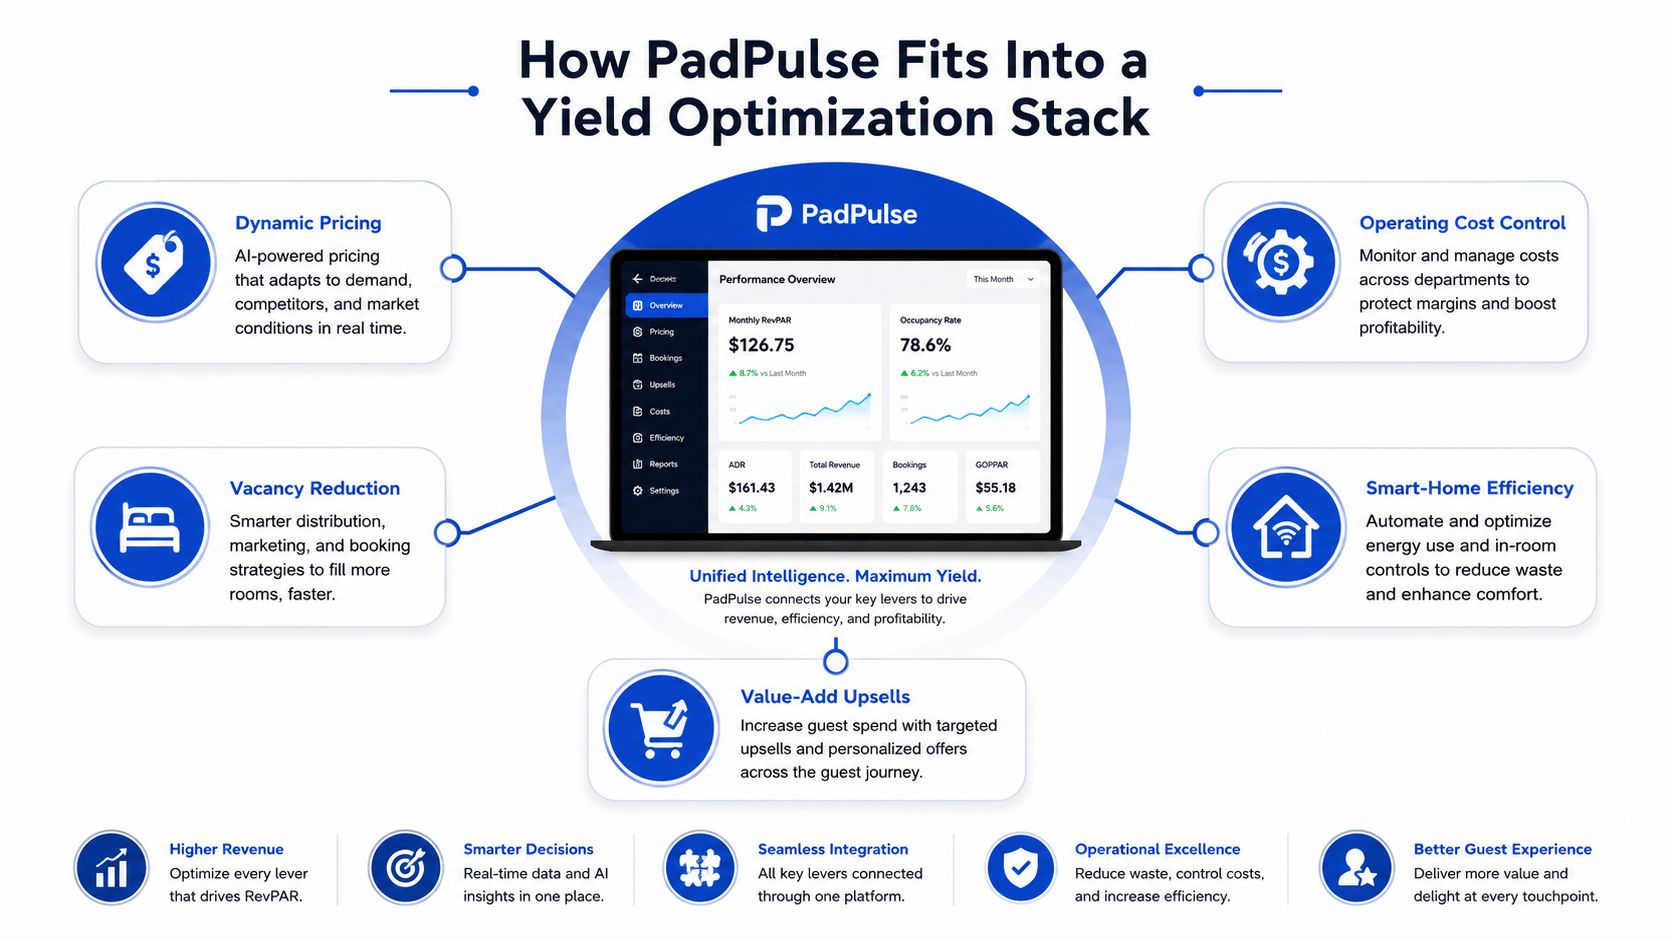
How PadPulse Fits Into a Yield Optimization Stack
A yield optimization stack needs one measurement layer. Without it, operators jump between rent spreadsheets, utility bills, messaging records, maintenance apps, and listing dashboards. The result is often a delayed decision based on incomplete information.
PadPulse is designed as an in-development management platform for PadSplit hosts and co-living operators. Its intended role is to connect the five core metrics and five operating levers in one place, rather than replace the operator's judgment.
What to review when yield stalls
A useful monthly dashboard should surface:
- Per-room revenue: Which bedrooms generate the strongest collected revenue, not merely the highest advertised rent.
- Occupancy trends: Where vacancy begins, how long it lasts, and which channel produces the next resident.
- Churn risk signals: Whether early departures cluster around a room, price point, house rule, or resident segment.
- Utility cost per bed: Whether a property's expense pattern is moving independently of occupancy.
- Comparable benchmarks: How rates, demand, and operating results compare with similar properties in the same ZIP code.
When yield stalls, look first for a mismatch between pricing inputs and local comparable data. A pricing recommendation based on stale or broad market information can be wrong for one neighborhood or one room type. The second common problem is churn. Dynamic pricing alone can't fix a resident who expected private-bath access, quieter housemates, better furnishings, or different rules.
Automation needs guardrails
A platform can suggest a rate, flag a vacancy risk, automate routine messaging, or connect smart locks and thermostats. It shouldn't decide resident fit, resolve disputes, approve sensitive exceptions, or replace judgment about capital improvements. Those decisions require context that a dashboard may not capture.
The value of a measurement system grows as an operator adds clean history and compares similar rooms. Planned benchmark and alerting features can make it easier to identify changes early, while revenue optimization software for property operators offers useful context for thinking about the measurement layer. The tool is only as good as the records, rules, and review process behind it.
Your Next 30 Days and the Road Ahead
You don't need to overhaul the property to begin. Use the next 30 days to create a reliable baseline and run one controlled experiment.
Week one, collect the records. Put the last 90 days of rent, vacancy days, utility bills, maintenance spending, cleaning, supplies, and churn notes into one spreadsheet. Separate each room so a full-house average can't hide a weak unit.
Week two, benchmark the market. Review nearby comparable rooms, current asking rents, available inventory, and the features that distinguish your property. Set a target RevPAR per room that reflects both rate and the rooms you expect to bill.
Week three, test two changes. Choose one pricing experiment and one cost-control action, such as a smart thermostat. Keep the changes narrow enough that you can identify what caused the result.
Week four, review the early signals. Check inquiries, applications, move-ins, vacancy duration, utility usage, service calls, and resident feedback. Formalize the change only if it improves the metric you intended to move without creating a new problem elsewhere.
Over the next quarter, layer in an upsell after the core experience is stable, revisit churn drivers at 30, 60, and 90 days, and create a monthly NOI review. Operators who want the benchmark and alerting layer pre-built can join the PadPulse early-adopter interest list for limited beta access and launch updates.
PadPulse is being built to centralize room-level pricing, vacancy signals, resident communications, smart-home controls, and NOI reporting for co-living operators. Visit PadPulse to join the early-adopter interest list and make your next 30-day yield optimization cycle easier to measure.