How to Calculate Net Operating Income for Rentals
August 25, 2026
You've got an eight-room house, every room has a different move-out date, and the spreadsheet still shows “gross rent” as if every room will stay occupied all year. That's where many co-living underwriting models go wrong. Net operating income, or NOI, only becomes useful when it reflects the way the property operates, including room-level vacancy, shared utilities, cleaning, and resident turns.
This guide shows how to calculate net operating income for a PadSplit-style rental using a practical bridge from potential rent to effective gross income, then to property-level operating profit. It also separates expenses that belong above the NOI line from financing and capital items that don't.
What Net Operating Income Actually Tells You About a Co-Living Property
NOI is the property's operating income after recurring operating expenses, before debt service, income taxes, depreciation, and capital expenditures. The standard formula is NOI = Effective Gross Income − Operating Expenses, as outlined in Wall Street Prep's NOI overview. Effective Gross Income, or EGI, begins with potential room rent, subtracts vacancy and credit loss, then adds recurring ancillary income.
For an eight-room PadSplit-style house, each room is its own revenue line. Residents may pay weekly rates ranging from $650 to $900, depending on the room, furnishings, location, and demand. Shared utilities, laundry, cleaning, and resident-ready turns also affect the property's operating result. A house can have strong advertised rent while producing weaker NOI if several rooms sit vacant for short periods or utility use runs above the underwriting assumption.
NOI gives operators and buyers a consistent way to compare properties without mixing in different mortgage terms or tax structures. Under the income approach to valuation, Value = NOI ÷ Cap Rate, and Cap Rate = NOI ÷ Value, as explained in this direct capitalization lesson.
Three decisions NOI supports
- Room pricing: Compare achieved rent for each room with local comps instead of applying one assumption across the house.
- Vacancy response: Decide whether to hold the target price or offer a temporary discount when a room is vacant.
- Capital decisions: Test whether improved operations produce enough property income to support a refinance or acquisition price.
NOI does not show cash remaining after mortgage payments. It can also conceal operating volatility. One smooth turn and several simultaneous turns may produce similar annual averages, while creating very different repair bills, vacancy losses, and management demands.
A reliable model therefore starts with EGI, not advertised rent. Operators who need consistent inspections, repairs, and resident-ready turns can use systems to manage property field teams. Missed work orders can become both longer vacancies and higher maintenance expense, reducing the NOI that looked attractive on paper.
Building Effective Gross Income From Room-by-Room Rent
Underwrite the house from the rooms upward. The operating bridge is Potential Gross Income − Vacancy and Credit Loss + Other Recurring Income = Effective Gross Income. This gross and effective income guide outlines the same separation between scheduled revenue and income the property can reasonably collect.
Start with potential room rent
Use the eight-room property introduced above:
- Eight rooms × $750 average weekly rent × 52 weeks = $312,000 annual Potential Gross Income.
This assumes every room stays occupied and every scheduled payment arrives. It establishes the ceiling, not the income figure to carry into NOI.
Room-by-room housing turns more often than a conventional single-family lease. For this example, apply a vacancy and credit loss assumption in the 8% to 12% range. That range reflects weekly turnover rather than a simple single-family vacancy model. At 10%, the loss is:
- $312,000 × 10% = $31,200
- $312,000 − $31,200 = $280,800 after vacancy and credit loss
Use room-level operating history when setting the assumption. Track days vacant, failed payments, concessions, and the time from notice to a new resident's move-in. A monthly occupancy snapshot can show a full house while short gaps between residents reduce collected income.
Add recurring ancillary income
EGI includes recurring revenue tied to the operating model, not rent alone.
- Application and administrative fees: At an average of $35 per move-in across roughly 14 annual turnovers, the annual amount is $490.
- Laundry income: At roughly $80 per month, annual laundry income is $960.
- Other lines: Add pet fees, parking, and storage only when the property's operating history supports them.
Using the specified lines:
$280,800 + $490 + $960 = $282,250
This is the revenue base before operating expenses. Exclude one-time sale proceeds, owner contributions, and service income that is not collected consistently.
The underwriting error operators see most often is applying one vacancy percentage to the whole property without examining room behavior. A failed payment, eviction, or sudden move-out can make one room unproductive immediately. Turn delays, shared-house disruption, or a concentrated wave of move-outs can also affect several rooms at once. Model those patterns through room-level vacancy and turn history, rather than relying only on the annual average.
Operating Expenses to Include and What to Leave Out
The cleanest way to protect NOI is to classify every expense before entering it in the model. Operating expenses are the recurring costs required to operate and maintain the property. Mortgage principal and interest, income taxes, depreciation, and capital expenditures don't belong in NOI, because NOI is a property-level operating metric rather than an owner-level profit measure, as explained by J.P. Morgan's calculation guide.
| Line Item | Count in NOI? | Co-Living Note |
|---|---|---|
| Property taxes | Yes | A recurring property expense |
| Insurance | Yes | Shared housing may require broader liability coverage |
| Owner-paid utilities | Yes | Water, electric, gas, and Wi-Fi are real operating costs |
| Internet | Yes | Usually supports the entire house |
| Pest control | Yes | Common areas and multiple residents can increase exposure |
| Cleaning between turns | Yes | Include recurring make-ready cleaning |
| Lawn care | Yes | A normal property maintenance cost |
| Repairs and maintenance | Yes | Budget recurring repairs separately from major improvements |
| Management fees | Yes | Include the cost of operating the house |
| Turnover costs | Yes | Average room turns across the operating period |
| Bad-debt reserve | Yes | Reflect expected vacancy and collection friction |
| Mortgage principal and interest | No | Financing affects cash flow, not NOI |
| Depreciation | No | A noncash accounting expense |
| Income taxes | No | Depends on the owner's tax position |
| Capital expenditures | No | Major replacements and renovations sit below NOI |
| Owner draws | No | A distribution, not a property operating expense |
The expenses generic templates miss
A shared house has a turn cost that a single-family model can understate. A per-room turn may include cleaning, paint, minor repairs, and replacement items, with the planning range specified here at $250 to $450 per room. If only two rooms turn in a month, don't treat the expense as unusual and remove it. Average it across the rooms and reporting period so NOI reflects normal operations.
Utilities also need special treatment. In a PadSplit-style house, residents may pay a flat weekly amount while the owner absorbs actual water, electric, gas, and Wi-Fi usage. Those costs belong in operating expenses. Splitting them evenly across rooms can be convenient, but it won't show which rooms or occupancy patterns create the load.
For older co-living stock, repairs and maintenance may be budgeted at roughly 8% to 12% of EGI, and PadSplit-style management allocations commonly fall around 8% to 10%, according to the benchmark guidance in this expense allocation resource. Treat these as underwriting assumptions to test, not guaranteed outcomes.
Walking Through Two Sample Co-Living NOI Calculations
A useful sample calculation should show every line, not just the final NOI. The eight-room house produces $282,250 of EGI under the assumptions above. The following expense model separates fixed costs from variable costs so you can see what changes when occupancy, room count, and turnover change.
For illustration, assume the eight-room property has the following annual operating expenses:
- Property taxes: $28,000
- Insurance: $12,000
- Pest control: $2,400
- Internet: $1,800
- Utilities: $32,000
- Cleaning and supplies: $9,600
- Repairs and maintenance: $28,225
- Room turnover: $16,800
- Management: $25,403
- Bad-debt reserve: $2,823
Total operating expenses equal $159,051. The resulting NOI is:
$282,250 − $159,051 = $123,199 annually, or approximately $10,267 per month.
That result is intentionally mechanical. It demonstrates the formula, but it doesn't prove the property is attractive. You still need to test whether utility usage, repairs, and turns match the house's actual history.
A smaller property exposes scale pressure
Now consider a four-room version with the same average weekly room rent and the same general operating structure. Potential rent is:
4 rooms × $750 × 52 weeks = $156,000
At 10% vacancy and credit loss, the loss is $15,600, leaving $140,400. Assume annual ancillary income of $490 in application and administrative fees plus $480 from laundry, producing EGI of $141,370.
A sample expense stack could include:
- Property taxes: $20,000
- Insurance: $8,000
- Pest control: $1,800
- Internet: $1,200
- Utilities: $18,000
- Cleaning and supplies: $5,000
- Repairs and maintenance: $14,137
- Room turnover: $8,400
- Management: $12,723
- Bad-debt reserve: $1,414
Total operating expenses are $90,674, leaving $50,696 annual NOI, or approximately $4,225 per month.
| Line Item | 8-Room House | 4-Room House |
|---|---|---|
| Potential room rent | $312,000 | $156,000 |
| Vacancy and credit loss | $31,200 | $15,600 |
| Other income | $1,450 | $970 |
| Effective Gross Income | $282,250 | $141,370 |
| Operating expenses | $159,051 | $90,674 |
| Annual NOI | $123,199 | $50,696 |
| Monthly NOI | Approximately $10,267 | Approximately $4,225 |
| NOI as a share of EGI | Approximately 44% | Approximately 36% |
The smaller property carries fewer rooms, but fixed costs consume more revenue. A single vacancy also represents a larger share of available room income, so the four-room model is more sensitive to one move-out.
Why NOI Quality Differs Across Property Types in 2026
Two properties can report similar NOI margins and still carry very different operating risk. A conventional multifamily property may have centralized systems and predictable utility usage, while a room-by-room house can produce denser revenue from the same building but require more frequent resident coordination, cleaning, and turns.
The available 2025 segment data shows this divergence clearly. Affordable multifamily recorded 5.7% income growth and 8.7% NOI growth, compared with 2.1% income growth and 2.2% NOI growth for market-rate properties, according to CREFC's published comparison. Those figures don't establish a universal margin for every PadSplit-style house, but they do show why asset segment and operating model matter.
A more useful comparison than a generic margin table
No verified source in the available data provides a complete, comparable table of typical NOI margins, average vacancy, and cap-rate ranges for affordable co-living, market-rate multifamily, single-family rentals, and short-term rentals. Rather than manufacture a table of unsupported figures, use the following qualitative comparison:
| Property Type | Typical NOI Margin | Avg Vacancy | Cap Rate Range |
|---|---|---|---|
| Affordable co-living | Depends heavily on utilities, turns, and room-level operations | Room-level and potentially volatile | Market-specific |
| Market-rate multifamily | Often benefits from scale and centralized operations | Property-level occupancy can be more stable | Market-specific |
| Single-family rentals | Lower operating complexity, but less revenue density | Usually concentrated in one lease | Market-specific |
| Short-term rentals | Revenue can be high but operating intensity is substantial | Sensitive to booking patterns and seasonality | Market-specific |
The quality question is more important than the headline NOI. Is income supported by durable demand, or by an aggressive rent assumption? Are expenses controlled through better operations, or merely deferred? For shared housing, utility exposure and turn frequency can compress margins even when room revenue looks strong.
Use property valuation methods for room-by-room assets to keep valuation tied to defensible operating assumptions. A high NOI built on temporary expense deferral isn't the same as a high NOI supported by stable collections and repeatable turns.
Common NOI Mistakes in Shared Housing and How to Avoid Them
New co-living investors often discover their NOI errors during the first year, when actual bills and resident movement replace acquisition assumptions. The formula isn't difficult. The difficult part is assigning each cost and revenue line to the period and room that generated it.
Errors that distort the operating picture
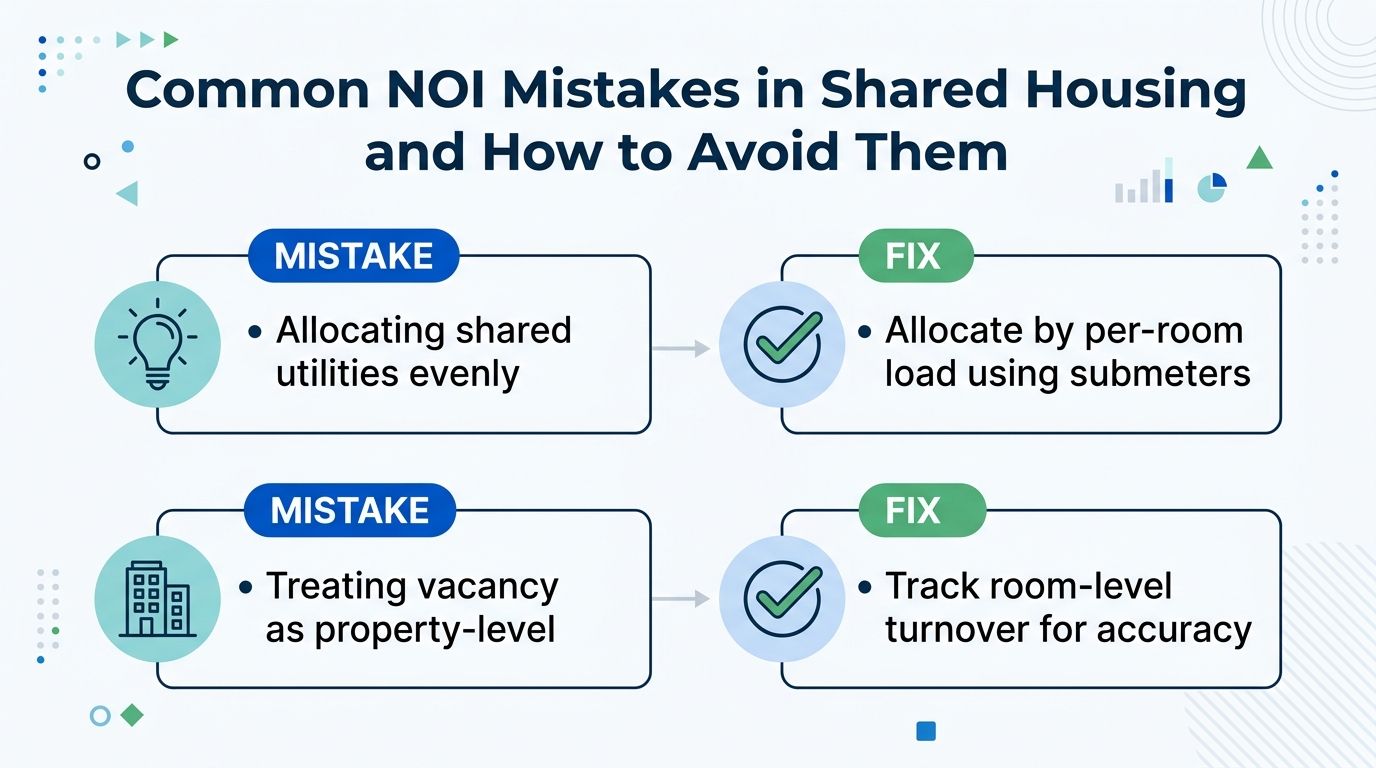
- Allocating utilities evenly: Dividing the electric bill equally across rooms can hide heavy usage from a particular occupancy pattern. Track usage by room where practical, or at least separate base load from occupancy-driven load.
- Treating vacancy as property-level: An eight-room house can be “mostly occupied” while one room turns repeatedly. Record vacancy by room, including the exact gap between residents.
- Ignoring turns: A move-out isn't complete when the key is returned. Cleaning, paint, repairs, and replacement items affect the next resident's start date and belong in recurring operating analysis.
- Mixing capital expenditures into OPEX: A roof replacement or major renovation shouldn't be buried in ordinary repairs. Capital expenditures are excluded from NOI under standard underwriting practice, as noted in this NOI and cap-rate reference.
- Under-reserving for pest and cleaning variance: Shared kitchens, bathrooms, and common areas can require more attention than a conventional single-family lease. Compare invoices with the assumed run rate instead of leaving a flat placeholder.
- Using gross rent instead of collected rent: Advertised weekly rent is not EGI. Subtract vacancy and credit loss, then add recurring ancillary income, before deducting operating expenses.
Practical rule: If a cost appears every operating period, model it as an operating cost even when the amount changes.
Don't solve an NOI problem by moving expenses below the line. Keep ordinary repairs, utilities, cleaning, management, and recurring turns visible. Otherwise, the model may look stronger while the property becomes harder to operate.
Actionable Levers to Improve NOI for PadSplit-Style Houses
NOI improves when the operator changes a recurring revenue or expense behavior. Use this as a weekly review rather than a one-time acquisition checklist.
- Tighten time-to-fill: Review every vacant room, the date it became available, response time, showing activity, and move-in blockers. Faster turns reduce vacancy loss without requiring a rent increase.
- Control utility exposure: Set a per-resident utility policy or investigate submetering where appropriate. A practical submetering guide from Axis Meter Solutions can help you evaluate the equipment and billing questions before changing the resident agreement.
- Standardize the turn scope: Define the required paint touch-up, deep clean, mattress replacement, safety check, and photo refresh. A repeatable scope makes turn costs easier to forecast and helps maintenance staff finish rooms consistently.
- Review recurring contracts: Request fresh bids for pest control and lawn care when contracts renew. Shared common areas amplify small service inefficiencies across the property.
- Price high-margin add-ons carefully: Parking, furnished-room premiums, pet fees, or other modest weekly charges can add revenue when residents value the service and the property can deliver it reliably.
Don't assign unsupported dollar or basis-point targets to these levers. Their effect depends on the house's current vacancy, utility load, staffing, lease structure, and expense baseline. Measure each change against the same EGI and expense definitions used in the NOI model.
Use the eight-room example as a control sheet. If two operating changes raise collected income or reduce recurring expense, update the model directly, then test whether the improvement persists after normal turns and utility bills. A rent increase isn't the only path. Better room readiness, faster response, tighter usage controls, and cleaner vendor management can improve NOI while protecting resident demand.
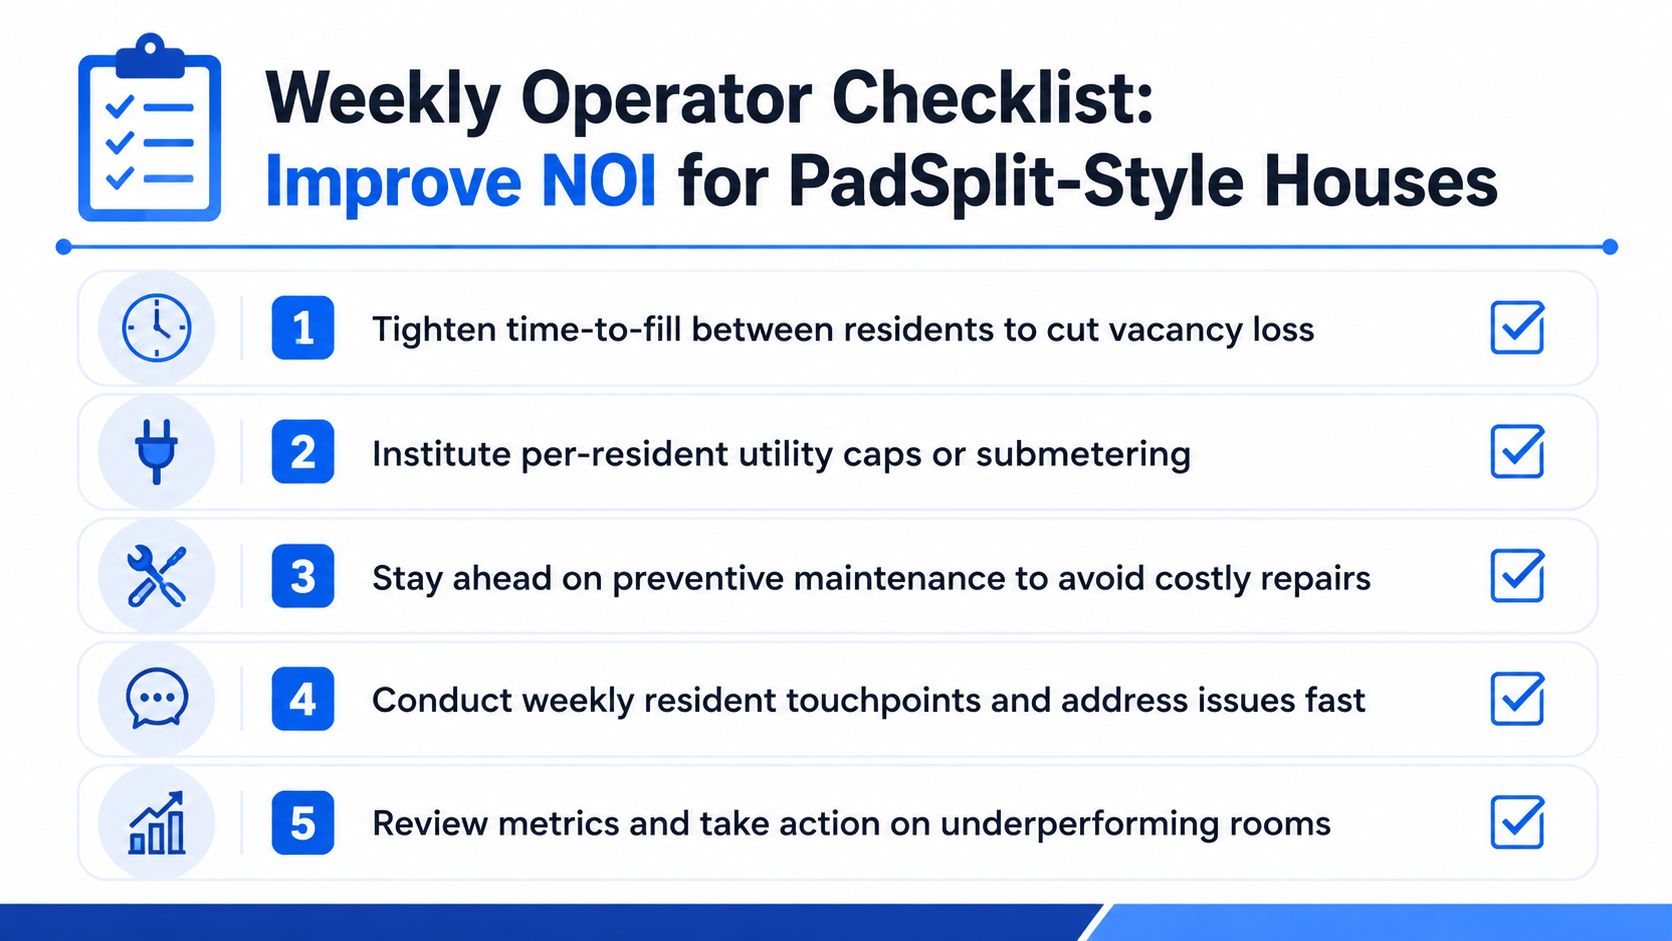
The calculation becomes more useful when the operator reviews it frequently, not just during refinancing. This short video adds another practical perspective on tracking the operating drivers behind NOI.
PadPulse is being built for PadSplit hosts and co-living operators who need room-level pricing, vacancy, communications, access, and P&L visibility in one workflow. Visit PadPulse to join the interest list, follow the planned Winter 2026 launch, and request limited beta access without billing before launch.