Turnover Cost Calculator for Room-by-Room Rentals
August 13, 2026
If you manage co-living houses, you already know the feeling. A room gets vacated, the cleaner is booked, the key gets changed, the listing goes live, and on paper it looks like a routine turn. Then the month closes and the NOI tells a different story.
That's where a turnover cost calculator earns its keep. In room-by-room rentals, the cost isn't just a clean and a fresh tenant. It's the vacancy drag, the repair reset, the utility churn, the admin time, and the lost rent that disappear every day a room sits empty. Generic HR turnover math, which is usually built around salary and hiring, misses the way shared-housing margins work. The Aspen Institute's turnover tool gets closer because it breaks turnover into separation, daily vacancy, recruitment and screening, onboarding, and indirect losses, but it's still framed around workers, not housing units (Aspen Institute turnover tool).
Why Turnover Math Hits Co-Living Hosts Differently
A mid-sized host with a six-room house can look at one empty room and think, “Fine, I'll lose a bit of rent and pay for cleaning.” Then the calendar starts working against them. Two weeks of vacancy can stack up a quiet series of costs, cleaning, repairs, marketing, admin follow-up, and the revenue gap itself, until that “simple” turn eats into a week of NOI without looking dramatic in any single line.
That's why room turnover needs to be treated like unit economics, not housekeeping. A vacant room isn't just an operational inconvenience, it's an underperforming asset. The central question is not whether the room is clean by move-in day, but whether the full turn preserved enough margin to justify the delay, labor, and churn around it.
Practical rule: If you only count cleaning and the next rent payment, you're not calculating turnover. You're estimating the most visible part of it.
A generic turnover calculator built for corporate roles usually starts from salary, recruiter time, onboarding time, and productivity loss. That logic can be useful for an office team, but it doesn't map cleanly onto a room in a shared house. For hosts, the important operating units are vacancy days and room revenue, which is why an internal profitability view matters more than a payroll lens. A useful companion read is the profitability analysis framework, because turnover should be tracked as part of the same margin picture.
| Cost bucket | What it covers | Why it is often missed |
|---|---|---|
| Vacancy drag | Lost rent while the room sits open | It feels like “just time,” not a line item |
| Reset labor | Cleaning, inspection, handoff work | It gets bundled into normal ops |
| Repairs and replacements | Small fixes, consumables, worn items | These costs are spread across vendors and receipts |
| Backfill overhead | Listing, screening, admin follow-up | The work is real, but usually invisible in P&L summaries |
The takeaway is simple. In co-living, turnover math gets sharper when you count what hits the room, not what HR calculators assume hits the payroll.
The Cost Buckets Every Turnover Calculator Needs
A good turnover cost calculator should separate the costs that show up when someone leaves, not flatten them into one blended number. The biggest mistake I see is treating “turnover” as if it were a single event. It isn't. It's a cluster of different expenses that happen across a move-out and the next move-in.
Start with labor, then add the physical reset
For room-by-room rentals, labor includes cleaning hours, inspection time, key handover, and any back-and-forth needed to get the room guest-ready. That work is often performed by the host, a cleaner, or a turnover crew, and it should be tracked separately from ongoing housekeeping. If you can't see it as its own bucket, it'll disappear into general operating labor.
Supplies should include cleaning products, toiletries, small repairs, and consumables that get replaced because the room changed occupants. That's different from monthly maintenance, which belongs in a separate bucket. Maintenance covers routine fixes between guests, like patching wear, replacing a broken fixture, or handling minor issues that would've been ignored in a long-term lease.
Keep fees and access changes visible
In shared housing, fees can include platform costs, payment processing, and any service charges tied to the backfill process. You may also have access-related expenses, such as lock or smart-access reprogramming, which are easy to overlook because they only happen on turnover. Utility churn matters too, especially when a vacancy changes what gets used and billed, even if it doesn't always appear as a single receipt.
One practical way to avoid bloated tracking is to separate one-time turnover costs from monthly operating costs. Don't pull in every recurring expense just because it happened near a move-out. Keep the calculator focused on what the vacancy itself created.
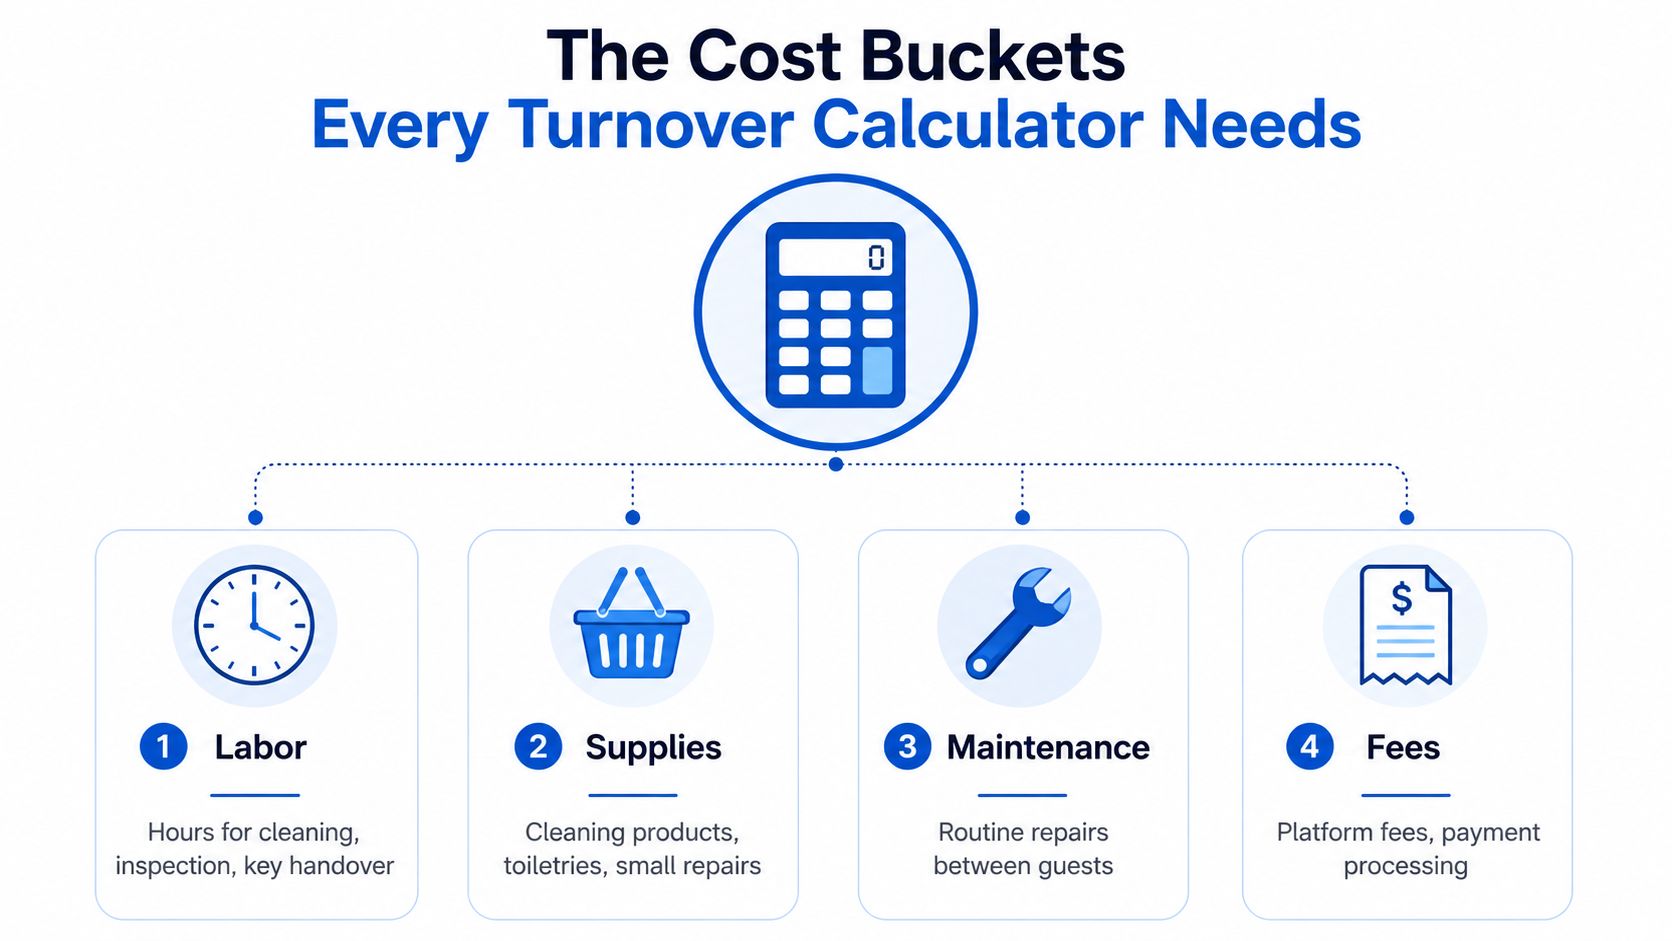
Clean buckets make the math honest. If a cost doesn't change because the room turned, leave it out.
That structure lines up with how turnover calculators are built in practice, separate inputs, separate assumptions, and separate buckets instead of one catch-all expense (Business Math Lab turnover cost calculator).
Formulas That Turn Inputs Into Real Numbers
The math gets useful once each bucket has a number attached. A practical formula starts by summing the per-turnover cost across labor, supplies, maintenance, fees, and access changes. Then it adds the vacancy drag, which is the lost daily rent multiplied by the number of days the room stayed open. Finally, annual turnover cost scales that per-turnover amount by how often the room turns over in a year.
That structure is consistent with how benchmark calculators work. One common formula converts salary or wage into a weekly or daily rate, multiplies by time-to-fill, and then multiplies by the number of departures (CalculatorUltra turnover cost calculator). Another approach asks for separate hiring, onboarding, training, and productivity inputs, then rolls them into a total that can also be viewed against payroll (HRBench cost of turnover calculator).
A room-level example
Say a room turns over and you log the following:
- Reset labor, supplies, and maintenance are grouped into a single turnover total.
- Vacancy drag is calculated from daily rent multiplied by days vacant.
- Annual turnover cost is the sum of each turn, multiplied by the number of room departures in the year.
You don't need a fancy model to see the point. The room that sits empty longer will cost more, even if the physical cleaning bill is lower. The room that turns fast but needs repeated repairs can also become expensive. That's why the calculator should show each bucket separately, not just one final number.
The right way to think about the formula is this.
Useful formula logic: per-turnover cost plus vacancy drag, then scaled by annual departures.
That's also why a simple salary multiple is a poor fit for co-living. The key variable is occupancy, not payroll. Once you start measuring turnover that way, you can see which rooms, vendors, and process delays are really hurting the property.
Building a Spreadsheet Template You Will Actually Use
A spreadsheet works best when it stays boring. Create one tab for inputs, one tab for turnovers, and one tab for summary. If the model takes too long to update, you won't keep it current, and stale assumptions are worse than rough assumptions.
Start with columns that match the actual turn flow:
- Room name or unit ID
- Move-out date
- Guest-ready date
- Vacancy days
- Reset labor
- Supplies
- Maintenance
- Access changes
- Backfill admin
- Lost rent
From there, add a summary row that calculates per-room turnover cost and a portfolio total. If you want a simple dashboard cell, show annualized turnover cost as a share of gross rent so you can compare rooms with very different revenue profiles. That gives you a quick read on whether a room's turnover is becoming too expensive relative to what it earns.
For tracking, use actual dates instead of manual day counts whenever you can. A move-out date and a guest-ready date are easier to audit later than a hand-entered number. In practice, that one habit cuts down on arguments over “was it 6 days or 8?” because the record is already there.
If you want a cleaner operating setup, a P&L template helps keep turnover costs tied to the rest of the house economics. The profit and loss statement template is the right mental model here, because turnover should land in the same reporting system as rent, repairs, and other operating expenses.

When the platform is ready, PadPulse is designed to keep pricing, communications, access control, and reporting in one place, which is exactly the kind of system that helps these spreadsheet numbers stay live instead of drifting out of date.
Sample Scenarios That Show the Numbers in Action
Two rooms can look similar on paper and still produce very different turnover outcomes. One gets cleaned fast, the listing is refreshed quickly, and the next member is in place before the week is over. The other gets delayed by repairs, a lock issue, and a slow response to inquiries, so the room stays open much longer and the monthly result takes the hit.
| Scenario | Per-turnover cost | Vacancy drag | Total annual cost |
|---|---|---|---|
| Fast, well-prepped turn | Lower reset and admin burden | Shorter vacancy window | Lower overall turnover burden |
| Slow turn with issues | Higher reset and admin burden | Longer vacancy window | Higher overall turnover burden |
The point of the comparison isn't that one room is magically better. It's that vacancy drag and process delays tend to matter more than the cleaning invoice alone. A room with a modest reset bill can still be the expensive one if it sits open too long.
What the numbers usually tell you
A quick turn usually wins when the workflow is tight, the access handoff is smooth, and the listing is already prepared. A slow turn usually loses when any one of those pieces breaks. In houses I've managed, the expense gap rarely came from one giant bill, it came from several small delays that stacked together.
A strong calculator makes that visible early. If a room's annualized turnover cost starts trending up, you can see whether the issue is labor, vacancy, or a backfill problem. That's far more actionable than waiting for a quarterly review and wondering why NOI softened.
The room that turns slowly isn't just a vacancy problem. It's usually a workflow problem wearing a vacancy mask.
High-ROI Moves That Actually Cut Turnover Cost
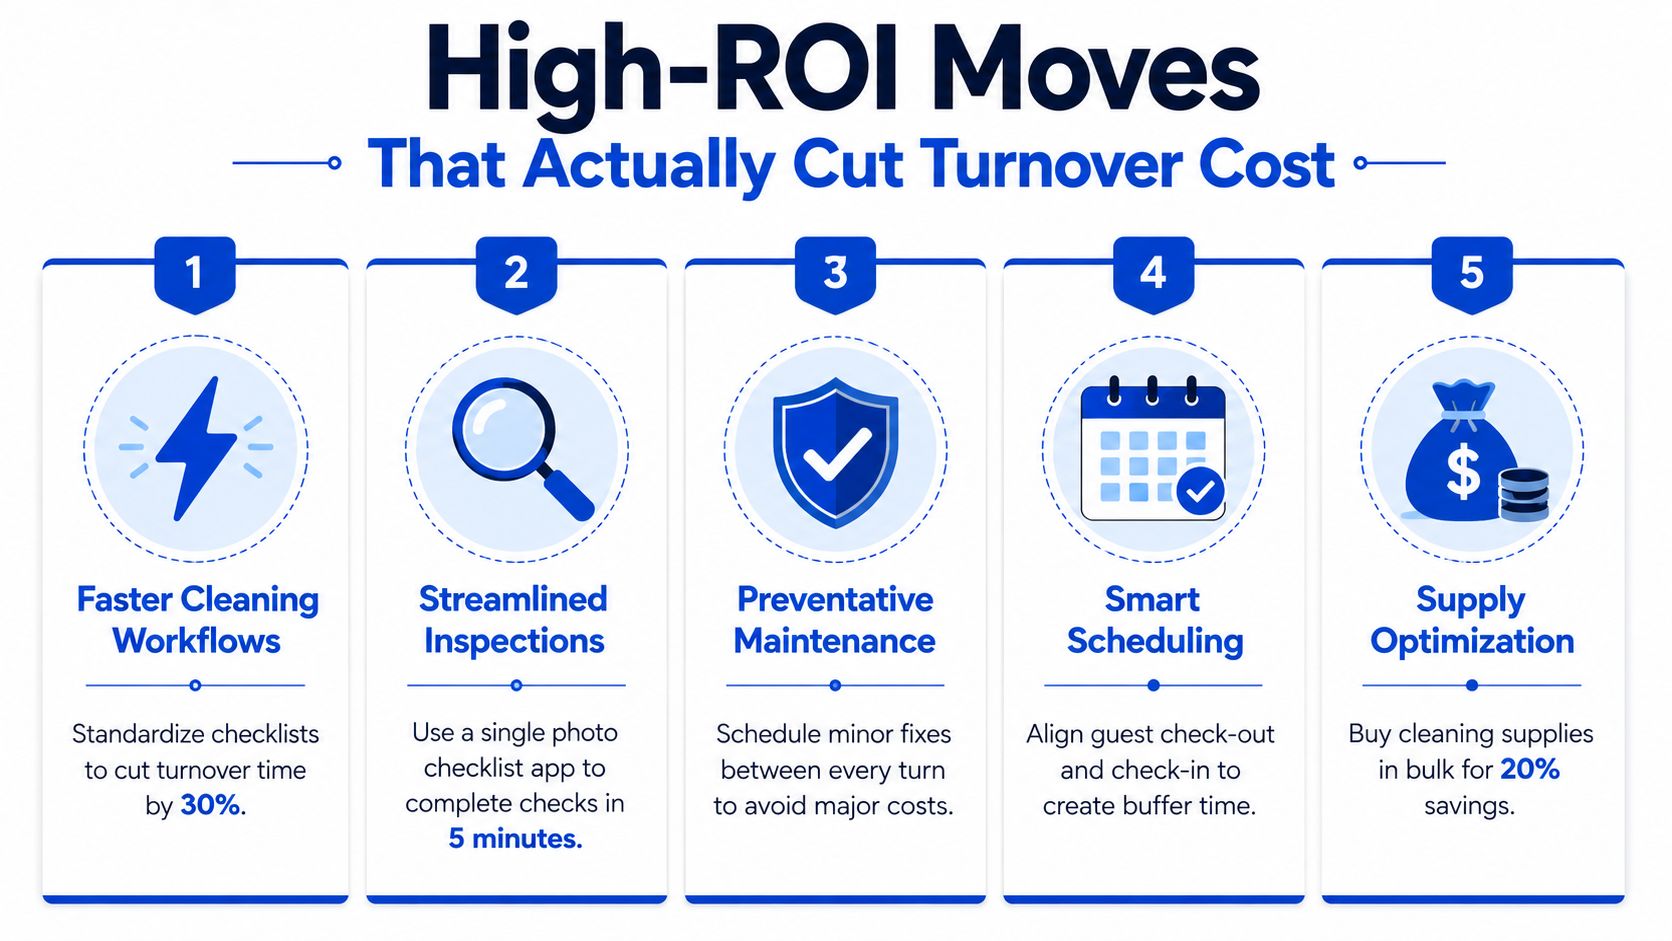
The fastest savings usually come from reducing delay, not squeezing vendors. I'd rank the best moves by effort versus impact this way. First, tighten the cleaning and inspection workflow so the room is ready when the team says it is. Second, handle preventive maintenance between turns so small issues don't force extra visits later. Third, keep listing templates ready so the room can be marketed immediately after notice.
Fourth, use smart access so you're not spending time on reprogramming or key handoff friction. Fifth, screen for fit more carefully so the room doesn't churn again too soon. The key is that each move should map to one of the buckets in the calculator, otherwise you won't know whether it helped.
Measure the result, not the intention
If you standardize checklists, the clean gets more predictable. If you improve inspections, you catch issues before move-in day. If you optimize supplies, you stop paying rush prices for basic items. Each of those changes should show up as lower labor, fewer maintenance resets, or a shorter vacancy window.
The most useful habit is to test one change at a time and then compare the new turn against the last few. That gives you a cleaner signal than trying to overhaul everything at once. A property management checklist helps with that discipline, and the property management checklists guide is a practical companion if your team is still improvising the move-out process.
One tool can also help centralize the work. PadPulse is building toward a platform that combines pricing, messaging, access, and reporting, which is relevant here because the calculator only stays useful if the operational data is easy to capture.
Turning the Calculator Into a Weekly Habit
A turnover model only helps if you keep looking at it. Set aside a short weekly review and check three things, the vacancy days for recent rooms, the next two weeks of scheduled turns, and whether annualized turnover cost is moving up or down. If the number is drifting in the wrong direction, the cause is usually already visible in the calendar.
The best weekly rhythm is simple.
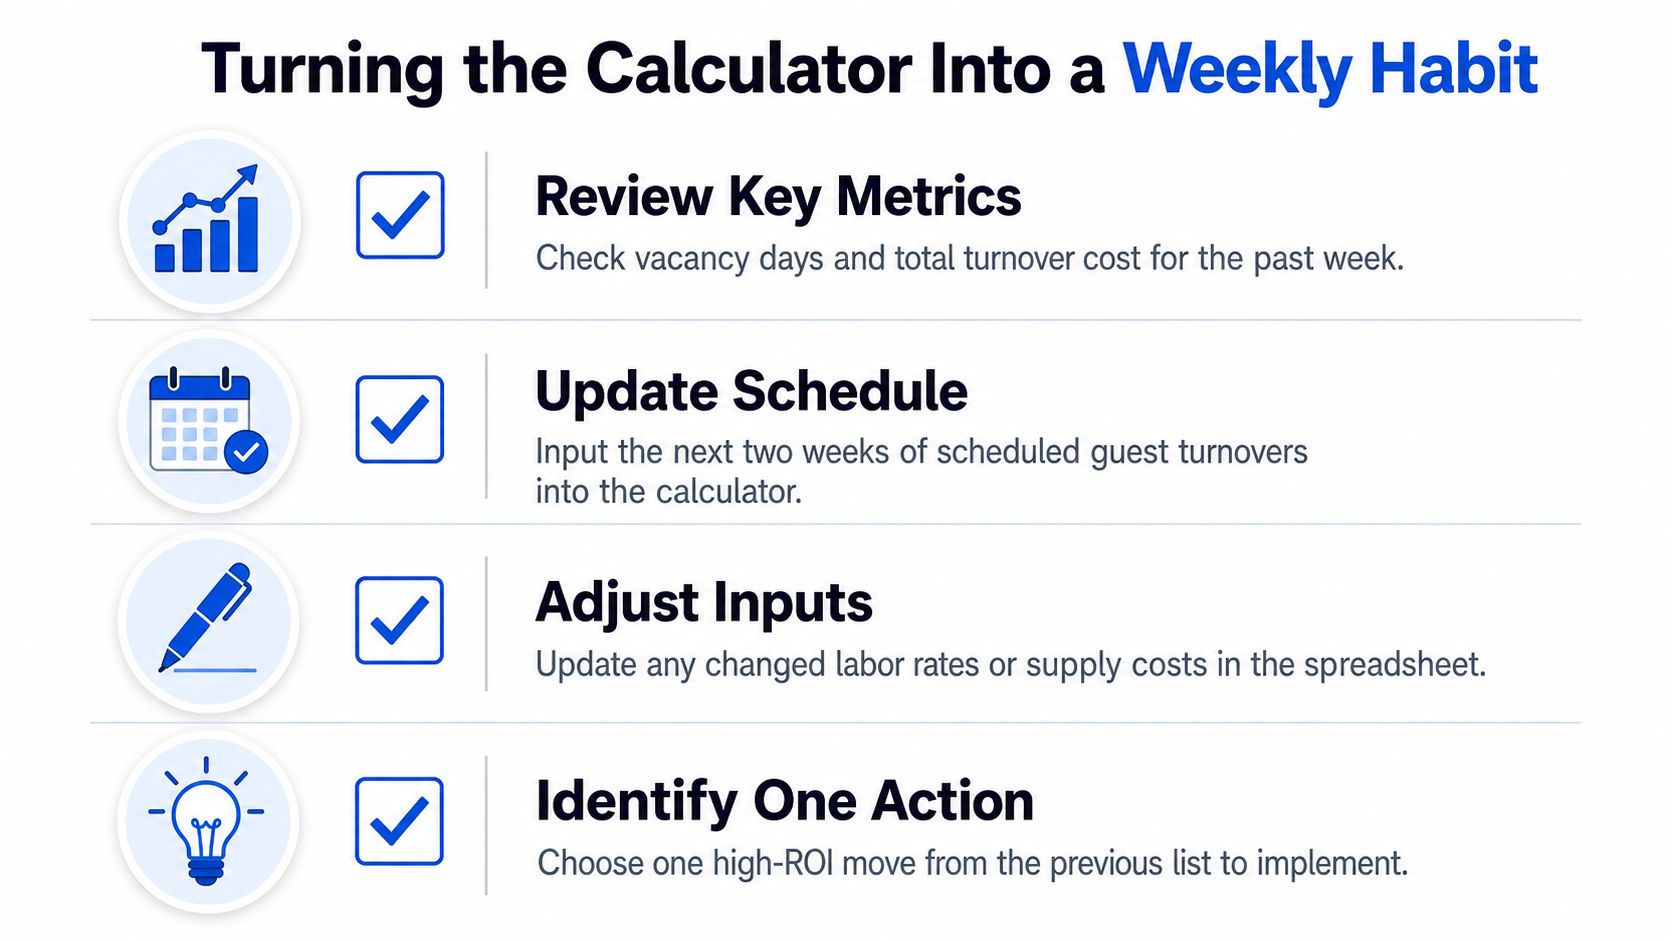
When the calculator becomes a habit, it stops being a finance exercise and starts becoming an operating control. That's what protects NOI. It also gives you a clearer basis for decisions on dynamic pricing, smart access, and centralized communications, which are the kinds of workflows PadPulse is building toward for its Winter 2026 launch.
The real win is not a prettier spreadsheet. It's a cleaner feedback loop between turnover, occupancy, and profit.
If turnover is eroding your room-by-room margin, build the habit now. Visit PadPulse to follow the platform's reporting and operations tools, and use that same framework to keep vacancy, pricing, and access decisions tied to the numbers that matter.