Profit and Loss Statement Template: Rental Business 2026
June 26, 2026
If you're managing a co-living house right now, your numbers probably live in too many places. Rent hits your bank account room by room. Utilities land in one lump sum. Cleaning, repairs, internet, and platform fees show up on different days. Then month-end arrives and you're left asking one basic question: did this property make money?
That's where a profit and loss statement template stops being an accounting exercise and starts becoming an operating tool. For room-by-room rentals, a basic small business spreadsheet isn't enough. You need a format that matches how co-living revenue and costs move.
Why Generic P&L Templates Fail Your Co-Living Business
A standard P&L works fine for a business with one sales line and a predictable expense stack. A co-living property doesn't look like that.
One house can have separate rent payments for each room, move-in fees, late fees, utility bill-backs, and small one-off charges. On the expense side, you might have shared internet, shared cleaning, consumables, lawn care, repairs, and labor that support the whole house instead of one unit. Generic templates rarely help you sort that cleanly.
A profit and loss statement is the report card for the business. It shows revenue, expenses, and whether you finished the period with a profit or loss. As Atlassian's guide to profit and loss statements explains, a template helps by standardizing the structure so revenue, COGS, operating expenses, taxes, interest, and net profit are included and calculated correctly.
Practical rule: If your template doesn't force you to capture every revenue stream and every expense category, it will give you a comforting number, not a reliable one.
What goes wrong with a generic template
A basic downloadable spreadsheet usually assumes:
- One top-line sales number instead of room-by-room rent collection
- Simple expense buckets that don't reflect shared housing operations
- No room-level visibility when one bedroom consistently outperforms another
- No allocation logic for internet, utilities, or house supplies
That last point matters more than most operators realize. In a traditional rental, one lease often maps to one unit. In co-living, one property can generate many micro-transactions that need to roll up into a clean monthly statement.
Why this matters for decisions
The right P&L doesn't just tell you what happened. It helps you decide what to do next.
You can use it to answer questions like:
- Which room types are strongest on rent?
- Are shared utility costs creeping up?
- Is cleaning spending tied to turnover, or is it becoming a standing overhead problem?
- Is the house profitable before financing costs?
- Which property deserves the next upgrade?
When operators skip that structure, they usually end up managing by bank balance. That's risky. Cash in the account can hide weak pricing, poor expense control, or a room mix that isn't pulling its weight.
Choosing and Downloading a Flexible P&L Template
The best starter template is usually the one that's easy to edit, not the one with the most bells and whistles. For most small operators, Google Sheets and Microsoft Excel are both fine. The key is flexibility.
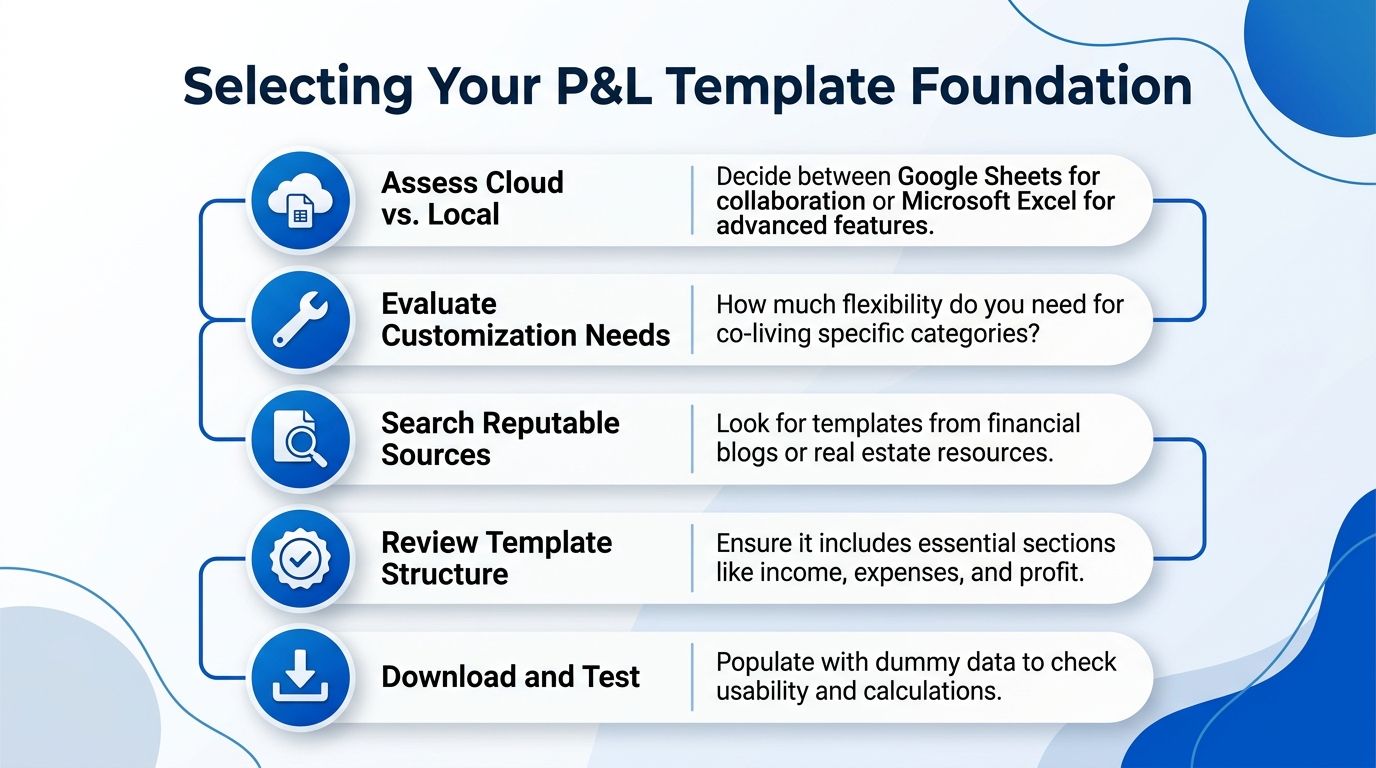
What to look for first
Most free templates are built for broad small business use. That's the first trade-off. They save setup time, but they usually assume revenue is centralized in a single line.
As FormSwift notes in its profit and loss template page, most profit and loss statement templates fail to guide users on adapting the P&L for room-by-room or co-living revenue models, where income is fragmented across many small transactions. That gap is exactly why a flexible base template matters more than a polished one.
Look for these traits:
- Editable fields so you can rename line items and add rows
- Monthly columns instead of annual-only formatting
- Visible formulas so you can audit how totals are calculated
- Clear section breaks between income, direct costs, operating expenses, and bottom-line results
- Simple formatting that won't break when you insert room-specific rows
Google Sheets versus Excel
Both work. The choice depends on how you operate.
- Google Sheets works well when multiple people touch the file, such as an owner, bookkeeper, or VA.
- Excel is often better if you prefer more control over formulas and offline use.
- Either option can become messy fast if you choose a locked template with hidden assumptions.
A good base template should feel boring. If it's too fancy to edit, it's the wrong starting point.
A quick test before you commit
Before you start entering live data, duplicate the file and run a small usability test.
Try these checks:
- Add four or five revenue rows for separate rooms.
- Insert a utilities section with electricity, water, gas, and internet split out.
- Add a non-operating section for interest and taxes.
- Change one formula and confirm totals still roll up correctly.
- Enter dummy data for one month and see if the result is easy to read.
If the template breaks during that test, it won't hold up under real operating pressure.
What not to optimize for
Don't spend too much time hunting for the perfect free download. In co-living, the template is only the frame. Its primary value comes from how you customize it for room-level revenue, shared costs, and property-by-property review.
Customizing Your Template for Room-by-Room Operations
The moment a generic spreadsheet becomes useful is when you stop treating the property like one rental and start treating it like a collection of revenue-producing rooms supported by shared operating costs.
Monthly reporting is the right cadence for most operators. QuickBooks Australia recommends monthly profit and loss statements for spotting financial trends, and that structure also helps you group expenses into COGS, operating expenses, and non-operating expenses for a cleaner net income calculation.
Build the income section around rooms
Start at the top line. Don't use one row called "Rent."
Break income into the categories you manage:
- Room rent by room. Room 1, Room 2, Room 3, and so on.
- Move-in or admin fees if you collect them.
- Late fees when they apply.
- Utility surcharges or amenity fees if those are billed separately.
- Other property income for unusual but real revenue items.
This gives you a monthly view of where money is coming from. It also makes vacancy patterns easier to spot because a blank room row stands out immediately.
Separate direct costs from operating overhead
A lot of operators throw every expense below revenue in one long list. That makes the statement harder to use.
Use three layers:
COGS
For co-living, COGS can include direct turnover or room-readiness costs tied closely to producing rental income.
Examples:
- Turn supplies for new occupants
- Room-specific consumables
- Direct onboarding costs tied to occupancy
Operating expenses
These are the costs of running the property day to day.
Examples include:
- Utilities
- Internet
- Cleaning
- Repairs and maintenance
- Lawn care
- Wages or contractor labor
- Software or management fees
Non-operating expenses
These sit below operations and should stay there.
Examples:
- Mortgage interest
- Taxes
- Depreciation
- Amortization
Keep financing costs separate from operating costs. If you mix them together, you lose sight of how the property performs as an operation.
Sample Co-Living Chart of Accounts
| Category | Account Type | Example |
|---|---|---|
| Revenue | Operating revenue | Room 1 rent |
| Revenue | Operating revenue | Room 2 rent |
| Revenue | Operating revenue | Room 3 rent |
| Revenue | Operating revenue | Room 4 rent |
| Revenue | Other operating revenue | Late fees |
| Revenue | Other operating revenue | Utility reimbursement |
| COGS | Direct occupancy cost | Turn supplies |
| COGS | Direct occupancy cost | Room setup items |
| Operating Expenses | Property operations | Electricity |
| Operating Expenses | Property operations | Water |
| Operating Expenses | Property operations | Gas |
| Operating Expenses | Property operations | Internet |
| Operating Expenses | Property operations | Cleaning |
| Operating Expenses | Property operations | Repairs and maintenance |
| Operating Expenses | Property operations | Lawn care |
| Operating Expenses | Admin or management | Management fee |
| Operating Expenses | Admin or management | Bookkeeping software |
| Non-operating Expenses | Financing | Mortgage interest |
| Non-operating Expenses | Statutory | Property taxes |
| Non-operating Expenses | Accounting | Depreciation |
Add a few columns that generic templates skip
For co-living, plain totals aren't enough. Add columns or tabs for:
- Property name
- Reporting month
- Room count
- Occupied rooms
- Vacant rooms
- Notes on unusual expenses
- Budget versus actual, if you track forecasts
If you want a stronger accounting foundation before building the template, this guide to property management accounting is a useful companion.
Keep the layout operator-friendly
The best custom template is one you can update in minutes, not one that looks like it came from a CPA exam.
Use these practical rules:
- Put all revenue rows first.
- Keep COGS in its own block.
- Group recurring house costs together.
- Put non-operating expenses below operating profit.
- Freeze the header row so month labels stay visible.
- Use formulas only where needed.
A clean template lets you review the month quickly and catch mistakes before they become habits.
Allocating Shared Costs and Calculating Per-Room Profitability
The hard part of co-living accounting isn't entering rent. It's assigning shared costs fairly enough that each room's economics make sense.
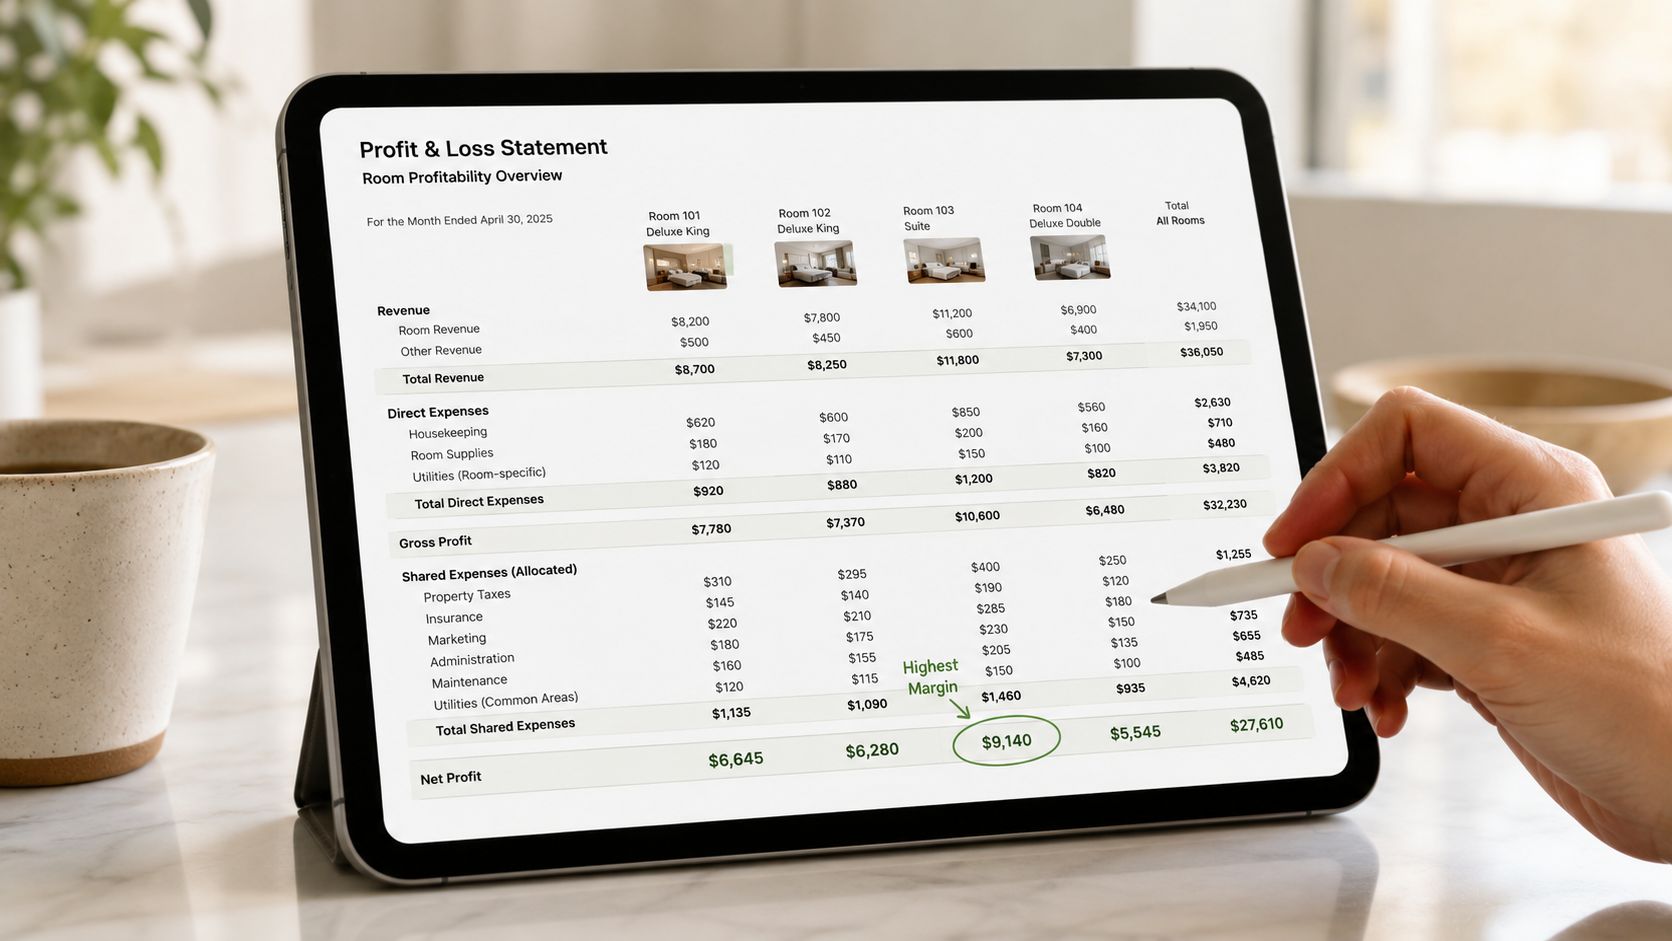
If you don't allocate shared costs, every room looks equally profitable on paper. That usually isn't true. The large room with stronger rent may be carrying the house. The smallest room may only work because you're averaging expenses across the property.
Two allocation methods that work in practice
You don't need a complicated model to get useful answers. Start with one of these approaches and stay consistent.
Equal split by room count
This is the fastest method. Divide shared expenses evenly across all rentable rooms.
Example:
- Internet bill: $100
- Number of rooms: 5
- Allocated internet cost per room: $20
This method works well for costs every occupant uses in roughly the same way, such as Wi-Fi or general cleaning.
Split by room size or value
For larger rooms, premium rooms, or layouts with a major size difference, use a weighted method based on square footage or relative room value.
This is more precise for:
- Utility allocation when one room has clearly different use patterns
- Premium furnished rooms
- Houses with basement suites or oversized primary rooms
The point isn't perfect accounting theory. The point is better decision-making.
Why revenue detail matters
Room-level revenue tracking proves its value. Paychex notes that operators who lump all room rents into a single line item miss demand differences between room types, leading to a 20% reduction in dynamic pricing accuracy and higher vacancy periods. For co-living, that means one weak room can hide inside a healthy-looking total.
If one room rents fast at every turn and another always needs a discount, the P&L should make that obvious.
A simple per-room NOI formula
Once you've allocated expenses, you can calculate per-room NOI, or net operating income at the room level.
Use this formula:
Per-room NOI = Room revenue - direct room costs - allocated operating expenses
For example, a room might include:
- Monthly room rent
- Less direct turnover supplies tied to that room
- Less allocated share of utilities
- Less allocated internet
- Less allocated cleaning
- Less allocated maintenance overhead
That gives you a cleaner view of the room's operating contribution before non-operating items like interest and taxes.
What operators learn from this fast
Per-room NOI helps you spot patterns that house-level totals hide:
- Underpriced rooms that fill instantly but leave money on the table
- Weak room types that need repositioning or upgrades
- Cost-heavy properties where shared expenses are eating margin
- Better capital decisions on furnishing, layout changes, or amenity upgrades
For beginners, equal allocation is enough to start. Once your reporting is stable, you can refine the method. The important part is having a repeatable rule and using it every month.
Bringing It All Together with a Filled-Out Example
A finished example makes the workflow much easier to trust. Below is the kind of structure I recommend for a small co-living house.
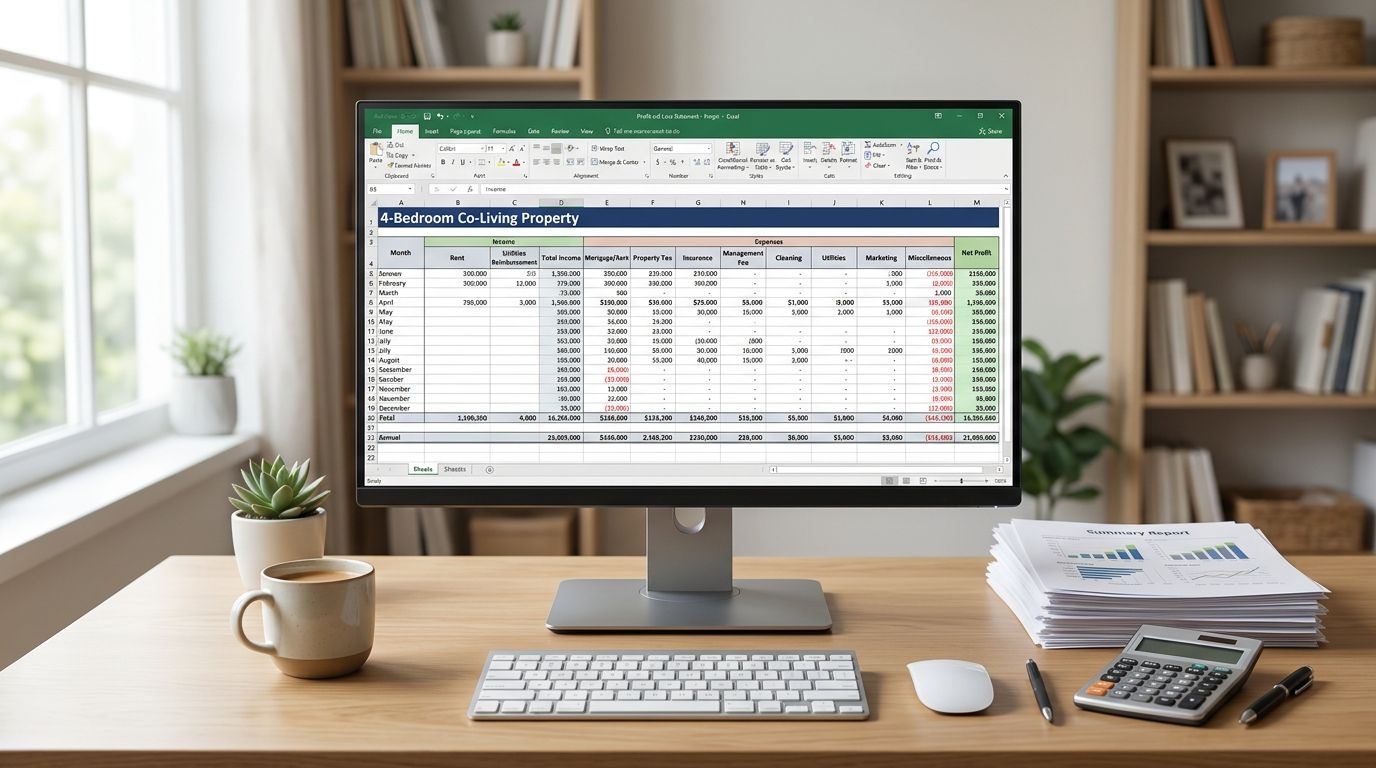
Assume a 4-bedroom property. Each room has its own rent line. The month also includes a late fee and separate utility reimbursement. Expenses are split into direct costs, operating expenses, and non-operating expenses so the statement reflects the actual financial story of the house.
A simple filled-out layout
The single-step approach is practical for small operators because it's fast to update and easy to review. QuickBooks explains that the single-step P&L is highly efficient for small operators, and it also stresses the importance of separating operating and non-operating expenses because misclassifying debt interest can inflate operating profit margins.
Here's a plain-language example of what the monthly P&L might include:
Revenue
- Room 1 rent
- Room 2 rent
- Room 3 rent
- Room 4 rent
- Late fee
- Utility reimbursement
COGS
- Turn supplies
- Room-ready cleaning tied to a move-in
Operating expenses
- Electricity
- Water
- Internet
- Shared cleaning
- Repairs and maintenance
- Lawn care
- Software or admin support
Non-operating expenses
- Mortgage interest
- Property taxes
- Depreciation
For a closer walkthrough of statement structure, this P&L report example gives a useful reference point.
Mortgage interest belongs below operating expenses. If you place it inside property operations, the house can look operationally weaker or stronger than it really is, depending on how you're reading the report.
How the formula works on the page
The math is straightforward:
Net income = total revenue - total expenses, with gains and losses included where relevant. The template does the heavy lifting if your categories are clean.
A strong monthly workflow looks like this:
- Enter each room's rent separately.
- Add any extra income lines.
- Enter direct costs tied to occupancy.
- List operating expenses for the property.
- Place financing and tax-related items below the operating section.
- Review the bottom line and compare it with prior months.
For a visual walkthrough, this short video gives a helpful overview:
The main value of a filled-out model isn't the spreadsheet itself. It's that you can glance at the month and immediately see whether the property made money operationally, where the pressure points are, and which line items deserve attention next month.
Automate Your P&L with Tools Built for Co-Living
A spreadsheet is a solid starting point. It teaches discipline, forces you to define categories, and helps you understand your property economics. But once you manage multiple houses, manual upkeep starts to drag.

The pain usually shows up in the same places:
- Data collection takes too long because rent, fees, and expenses come from different systems.
- Forecasting gets stale because your sheet shows what happened, not what changing occupancy may do next.
- Variance review is weak because most templates don't flag why actual performance missed the plan.
- Portfolio reporting breaks down when every property has its own slightly different spreadsheet logic.
That gap is real. SCORE's 12-month profit and loss projection resource is tied to a finding that 74% of small landlords struggle to reconcile P&L forecasts with actuals because their templates don't flag occupancy-driven revenue gaps or dynamic pricing variances.
When automation starts making sense
Manual templates work best when:
- you have one or two properties,
- you're still learning your operating model,
- and you want full control over every line item.
Software becomes more attractive when:
- you need faster monthly close,
- you want cleaner portfolio comparisons,
- you track pricing changes often,
- or you don't want reporting quality to depend on one person's spreadsheet habits.
What to look for in a co-living platform
A generic property tool often handles unit-based rentals better than room-by-room housing. Co-living operators need a tighter fit.
The features that matter most are:
- Room-level revenue tracking
- Forecast versus actual visibility
- Occupancy-aware reporting
- Dynamic pricing support
- Portfolio-level P&L views
If you want to see what that kind of workflow looks like in practice, PadPulse's profit and loss feature overview shows the kind of reporting serious room-by-room operators should expect from purpose-built software.
The right profit and loss statement template gives you control. Automation gives you time back and makes that control scalable.
If you're running PadSplit or co-living properties and want a simpler way to manage pricing, reporting, and operations, join the interest list for PadPulse. It's being built for room-by-room operators who need better visibility into NOI without living in spreadsheets.