P&L Report Example for Room-by-Room Rentals
June 13, 2026
Rent is hitting your account. The house looks occupied. Messages are coming in. On paper, things feel busy and healthy.
But busy isn't the same as profitable.
A lot of room-by-room hosts get stuck right there. They can tell you what each member pays. They can usually tell you whether a room is vacant. But if you ask, “How much did this house make last month after utilities, cleaning, supplies, platform fees, and repairs?” the answer gets fuzzy fast.
That's where a good P&L report example helps. Not as an accounting exercise. As a reality check.
For a PadSplit-style or co-living rental, your bank balance alone can fool you. A big rent week can hide rising utility bills. A full house can still underperform if one room attracts constant turnover and repair costs. And a “profitable” property can feel tight on cash if you're not separating direct property costs from business overhead.
Are You Collecting Rent or Actually Making a Profit
A new host I once talked with had the same problem most operators have early on. He knew his rooms were filling. He knew money was coming in. He also knew he felt more stressed than he expected.
Every month, he checked deposits. Every month, he paid bills. But he couldn't answer a simple question: was the property improving, or was he just moving money around?
That confusion usually starts because hosts track rent collection, not profitability. A rent ledger tells you who paid and who didn't. That matters. If you need a refresher, this guide on what a rent ledger means is useful. But a ledger alone won't tell you whether your operation is making good money after the costs of running it.
A profit and loss statement, or P&L, is the report that fills that gap. It's an income statement that summarizes revenues, costs, and expenses over a defined period, and it's commonly prepared monthly, quarterly, or annually, according to Paychex's explanation of profit and loss statements.
For room-by-room rentals, that timing matters more than most hosts realize. You need a time-based view to see whether:
- Rent collections are improving from one period to the next
- Vacancy loss is shrinking as your leasing process gets better
- Operating costs are drifting up even when occupancy looks stable
- Profitability is growing instead of just feeling active
The house can feel full and still underperform if the wrong costs are hiding below the surface.
Think of the P&L as the scorecard for the property's work. Your rooms produce revenue. Your operating system consumes money. The P&L shows what's left after both sides meet.
For a beginner, that's the big mindset shift. You're not just managing beds. You're managing a small operating business inside a house.
Once you see the property that way, the report stops feeling intimidating. It becomes practical. You start using it to make everyday decisions about pricing, utilities, turnover, maintenance, and staffing. And that's where a rental-specific P&L report example becomes far more useful than the generic versions made for a coffee shop or online store.
Core Components of a Rental P&L Report
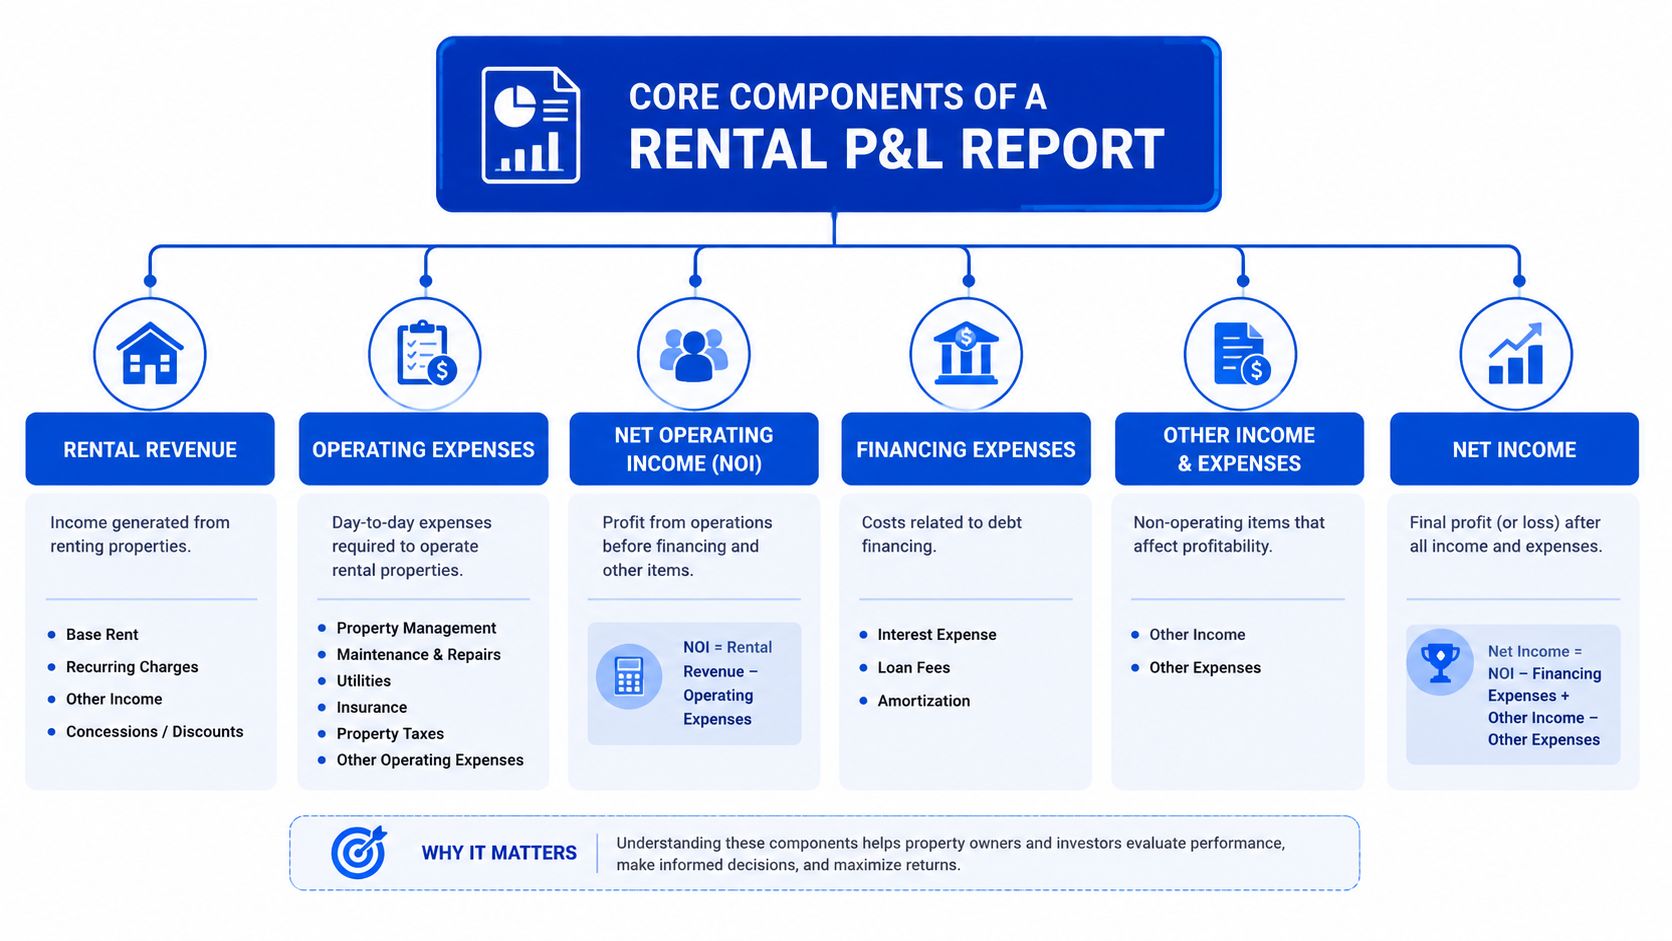
A rental P&L is basically a financial report card. It shows whether the property earned enough to cover its direct operating costs, its broader running costs, and still leave you with a meaningful bottom line.
The structure matters. A useful report isn't just a list of money in and money out. It needs layers.
The four layers that matter
A P&L report should be built around revenue, direct costs, operating expenses, and net income. That layered structure matters because it separates property-level economics from general overhead, as explained in Taxfyle's breakdown of profit and loss statements.
Here's what that looks like in plain language.
| Layer | What it means for a room-by-room rental | Why it matters |
|---|---|---|
| Revenue | Room rent, fees, and any other property income | Shows the top line the house generates |
| Direct costs | Expenses tied closely to occupied rooms and day-to-day property delivery | Helps you see if the unit economics work |
| Operating expenses | Broader running costs that support the property or business | Shows whether overhead is dragging profit |
| Net income | What remains after all expenses are recognized | Tells you whether the business actually made money |
What belongs in each bucket
New hosts commonly get confused. They lump everything into one big expense pile, then wonder why the report doesn't help them make decisions.
Try thinking in buckets.
- Revenue includes room rent, late fees if applicable, and any other recurring property income.
- Direct costs usually include items you'd expect to rise or fall with occupancy, such as prorated utilities, room turns, supplies tied to active occupancy, and room-specific repairs.
- Operating expenses often include insurance, software, admin help, bookkeeping, marketing, and other costs that support the operation but aren't tied to one specific occupied room.
- Net income is the bottom line after the full stack of costs is included.
Practical rule: If an expense exists because a specific room is occupied, it usually belongs closer to direct costs. If it exists because you run the business at all, it usually belongs below that as operating expense.
Why this layout is so useful
This format helps you diagnose the underlying problem.
If revenue is healthy but gross profit feels weak, the issue is often inside your direct costs. Utilities may be too high. Turn costs may be too frequent. Pricing may be too soft for the room type.
If gross profit looks decent but net income disappoints, the issue may be overhead. Too much admin drag. Too many scattered subscriptions. Marketing that isn't paying off.
That's why a proper P&L report example is so valuable for a co-living operator. It doesn't just tell you whether money came in. It tells you where the machine is leaking.
An Annotated Room-by-Room P&L Example
For a standard rental, one property-level P&L may be enough. For a room-by-room model, it usually isn't.
A shared house can hide weak performance inside a single room. One bedroom may stay full with low maintenance. Another may have frequent vacancy, higher utility usage, and repeated turnover supplies. If you only look at the house total, you miss that story.
Modern small-business guidance increasingly emphasizes segmented revenue analysis. For co-living operators, that means asking which room, house, or market is driving NOI, not just looking at one rolled-up total, as noted in Paro's discussion of P&L analysis and segmented revenue.
If you want software-focused visibility into that kind of reporting, PadPulse's profit and loss feature overview shows the direction many hosts are moving toward.
A simple room-level template
Here's a practical P&L report example for one room in a shared house. I'm using labels instead of made-up numbers so you can copy the structure into a spreadsheet right away.
| Line item | What to enter | Why it belongs here |
|---|---|---|
| Room rent | Monthly rent collected for that room | Your primary revenue line |
| Other room income | Any recurring room-related income you track separately | Keeps extra income visible |
| Less vacancy loss | Expected or actual lost rent for unoccupied days | Treats emptiness as a real operating drag |
| Effective room revenue | Revenue after vacancy impact | More honest than scheduled rent |
| Prorated utilities | The room's share of power, water, gas, internet | Ties shared costs back to occupied space |
| Cleaning and turn supplies | Linen replacement, consumables, move-in prep | Often rises with turnover |
| Room-specific repairs | Lock replacement, patching, minor room fixes | Helps flag problem rooms |
| Platform or collection fees | Any room-level transaction-related cost | Keeps revenue friction visible |
| Gross profit by room | Effective room revenue minus direct room costs | Your room-level operating contribution |
How to read it like an operator
Start at the top. Room rent is the number you expect to earn if the room stays occupied and collected.
Then subtract vacancy loss. This is one of the biggest blind spots for new hosts. They treat vacancy as “absence of income” instead of tracking it as a performance issue. But when you track it directly, you can compare rooms and spot patterns. A room with repeated vacancy may have a pricing problem, a listing problem, or a condition problem.
Then assign prorated utilities. This doesn't have to be perfect to be useful. The goal is consistency. If internet, electricity, water, and shared services support all occupied rooms, you need a method to spread those costs so one room's apparent profitability doesn't look artificially high.
What this tells you in real life
This room-level view helps answer questions like:
- Which room type is strongest for pricing power
- Which room is expensive to keep occupied
- Whether a vacancy is hurting more than expected
- Whether repeated repairs are tied to one part of the house
A room that looks “fine” at the house level can be your weakest performer once you assign utilities, turnover, and vacancy loss properly.
That's why I like hosts to build this view before they obsess over a polished portfolio dashboard. If the room-level economics are messy, the property-level report will only hide the mess more elegantly.
A few tracking habits that make this easier
You don't need a CPA-level setup on day one. You need clean habits.
- Name rooms consistently so every transaction maps back to the same unit
- Track vacancy separately instead of just accepting lower rent totals
- Use repeatable utility allocation rules even if they're simple
- Create a repair note field so you can see repeat problem rooms over time
Once you do that, your P&L report example stops being theoretical. It becomes a tool for pricing one room differently, tightening turnover standards, or fixing a room that drains NOI undetected.
An Annotated Portfolio-Level P&L Example
You can have a house that feels busy every week, rooms full, rent coming in, and still end the month wondering why your cash balance barely moved. That is the moment a portfolio-level P&L starts doing real work.
At the room level, you're checking whether each bedroom pulls its weight. At the portfolio level, you're asking a different question: which houses produce healthy NOI once shared property costs and business overhead are included? For PadSplit and other room-by-room rentals, that distinction matters a lot because small leaks across several houses can erode the profit from your best property.
Read the portfolio P&L in layers
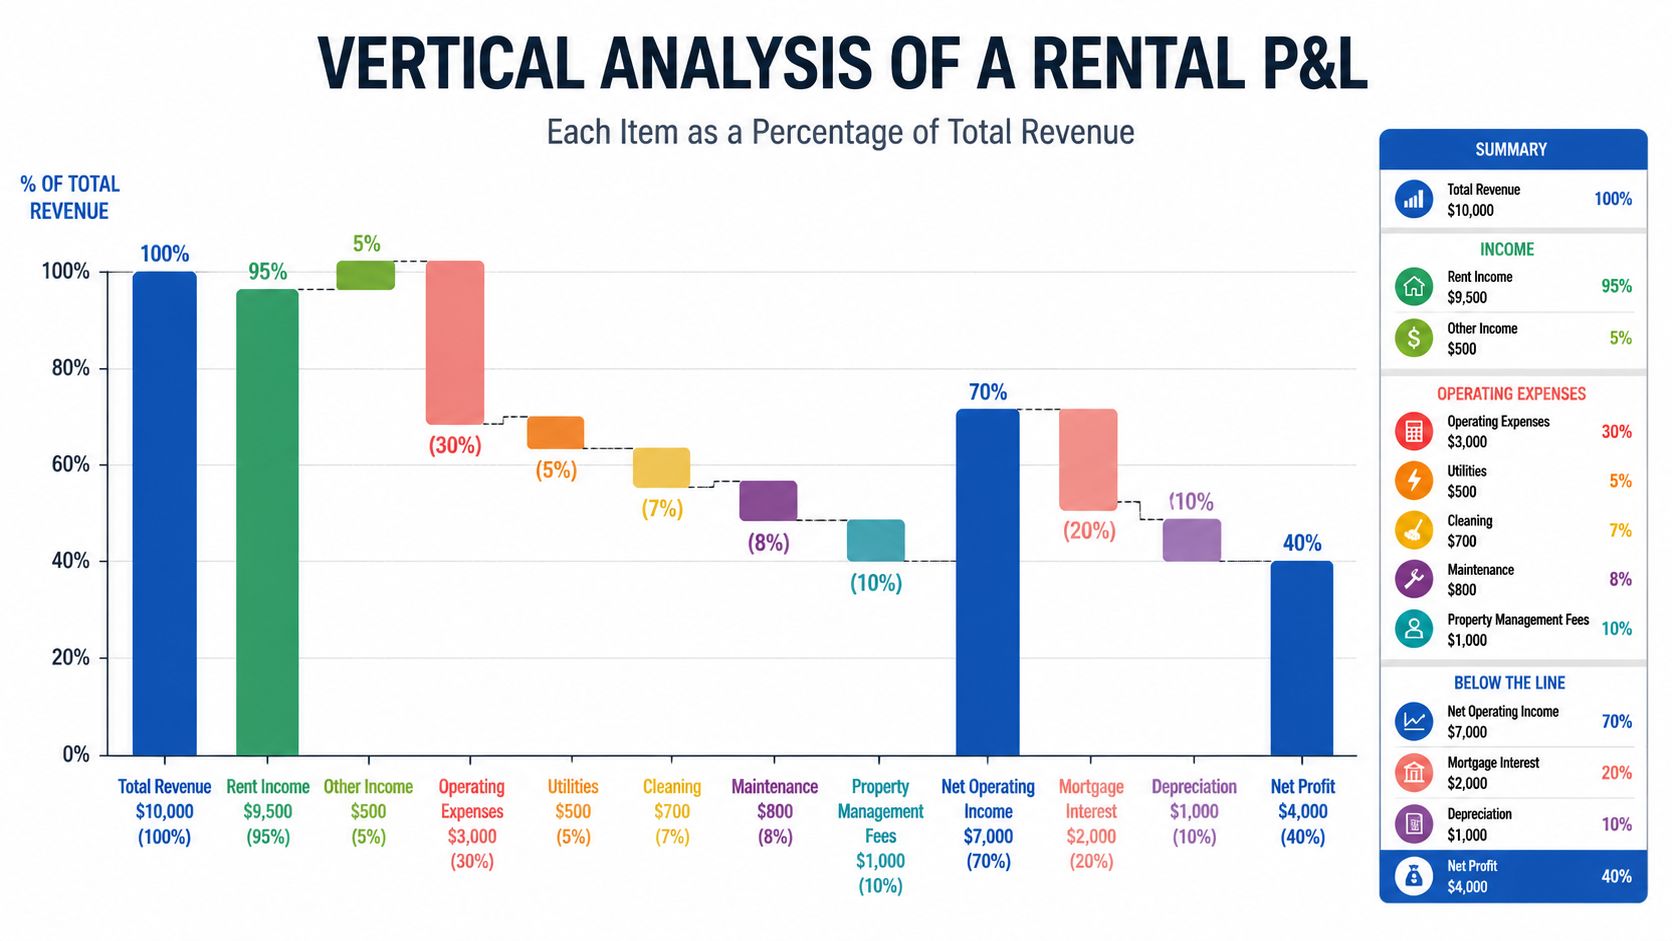
A portfolio report works like stacking trays in a kitchen. The top tray is room revenue. The next tray holds property costs that support those rooms. The bottom tray carries the overhead needed to run the whole operation.
I like to read it in this order:
- Room revenue rolled up by house
- Shared property costs under each house
- Company or portfolio overhead below the property results
That order keeps your eye on operations first. You see what each house earns before debt payments, taxes, depreciation, or owner-specific decisions blur the picture.
Here's a simple template for a room-by-room rental portfolio.
| Section | Example line items for room-by-room rentals |
|---|---|
| Revenue | Total room rent, fees, other property income |
| Direct property costs | Vacancy loss, utilities, cleaning, room turns, supplies, repairs |
| Property operating contribution | Revenue minus direct property costs |
| Property-level operating expenses | Insurance, common area maintenance, lawn care, pest control, software tied to operations |
| NOI view | Property operating contribution minus property-level operating expenses |
| Below-NOI items | Financing costs, depreciation, taxes, owner-level overhead if you track separately |
Keep house performance separate from financing
This is the spot where new hosts often blur two different stories.
Story one is operational performance. Are the rooms priced well? Are utilities under control? Is vacancy loss creeping up? Are turns and repairs eating the margin?
Story two is ownership structure. How much debt is on the property? What interest rate are you paying? Did you refinance recently? Those items matter to your cash flow, but they do not tell you whether the house itself is being run well.
If House A produces solid NOI but shows weak final profit after debt service, the property may still be healthy from an operations standpoint. The financing stack may be the underlying issue.
That matters when you compare houses across a portfolio. One house can look worse on the bottom line because it carries a heavier loan, while another looks stronger because the debt is lighter. If you mix those together too early, you can end up fixing the wrong problem.
A short walkthrough helps:
What this looks like in practice
Say you run three co-living houses.
- House 1 has strong occupancy and steady pricing, but utilities run hot because residents stay longer and usage stays high.
- House 2 looks fine from a rent collection standpoint, but vacancy loss and room turn costs keep dragging down the property contribution.
- House 3 produces healthy NOI, yet the final cash left over feels thin because the loan payment is heavy.
A portfolio P&L lets you see those as separate issues instead of one blurry “profit problem.”
That clarity is what helps you act. House 1 may need utility controls or better room pricing. House 2 may need a faster turn process or better lead flow. House 3 may not need any operational fix at all. It may have a financing structure that squeezes owner cash flow.
Use percentages, not just dollars
Dollar totals matter, but percentages make comparison easier across different houses.
A six-bedroom property and a ten-bedroom property should not be judged by raw expense totals alone. Utilities, repairs, and vacancy loss need to be read as a share of revenue so you can compare performance on equal footing. That is especially useful in room-by-room portfolios where one house may be larger, newer, or in a different utility market than another.
For hosts, a few percentage views are especially helpful:
- Vacancy loss as a percent of scheduled rent
- Utilities as a percent of collected rent
- Repairs and maintenance as a percent of revenue
- NOI margin by property
- Portfolio overhead as a percent of total portfolio revenue
Those percentages show whether a house has a size problem, a pricing problem, or a cost-control problem.
What a portfolio view helps you decide
A clean portfolio-level P&L helps you make operating decisions that affect your bank account directly:
- Which house is carrying the portfolio
- Which house has the best NOI margin, not just the highest rent
- Whether overhead is reasonable for the number of rooms you manage
- Whether recurring vacancy loss is concentrated in one house
- Whether one property has good operations but weak owner cash flow because of financing
That is the value of rolling room data up to the portfolio level. You keep the bedroom detail, but you also get the manager's view. And that is the view that helps a host decide where to raise pricing, where to cut waste, and which property deserves the next round of attention.
How to Use Your P&L to Increase Profitability
You collect rent all month, glance at the bank balance, and feel fine. Then mortgage day hits, a utility bill lands, one room sits empty for nine days, and the “profitable” house suddenly feels tight on cash. That is where a P&L earns its keep for a room-by-room host. It shows why money came in, where it went, and which part of the house operation needs attention first.
The most useful way to read a rental P&L is to use two checks together. First, read each line as a share of revenue. Then compare this month with prior months. One shows where your margin is getting squeezed. The other shows whether the issue is a one-off hit or a pattern.
Use vertical analysis to spot pressure points
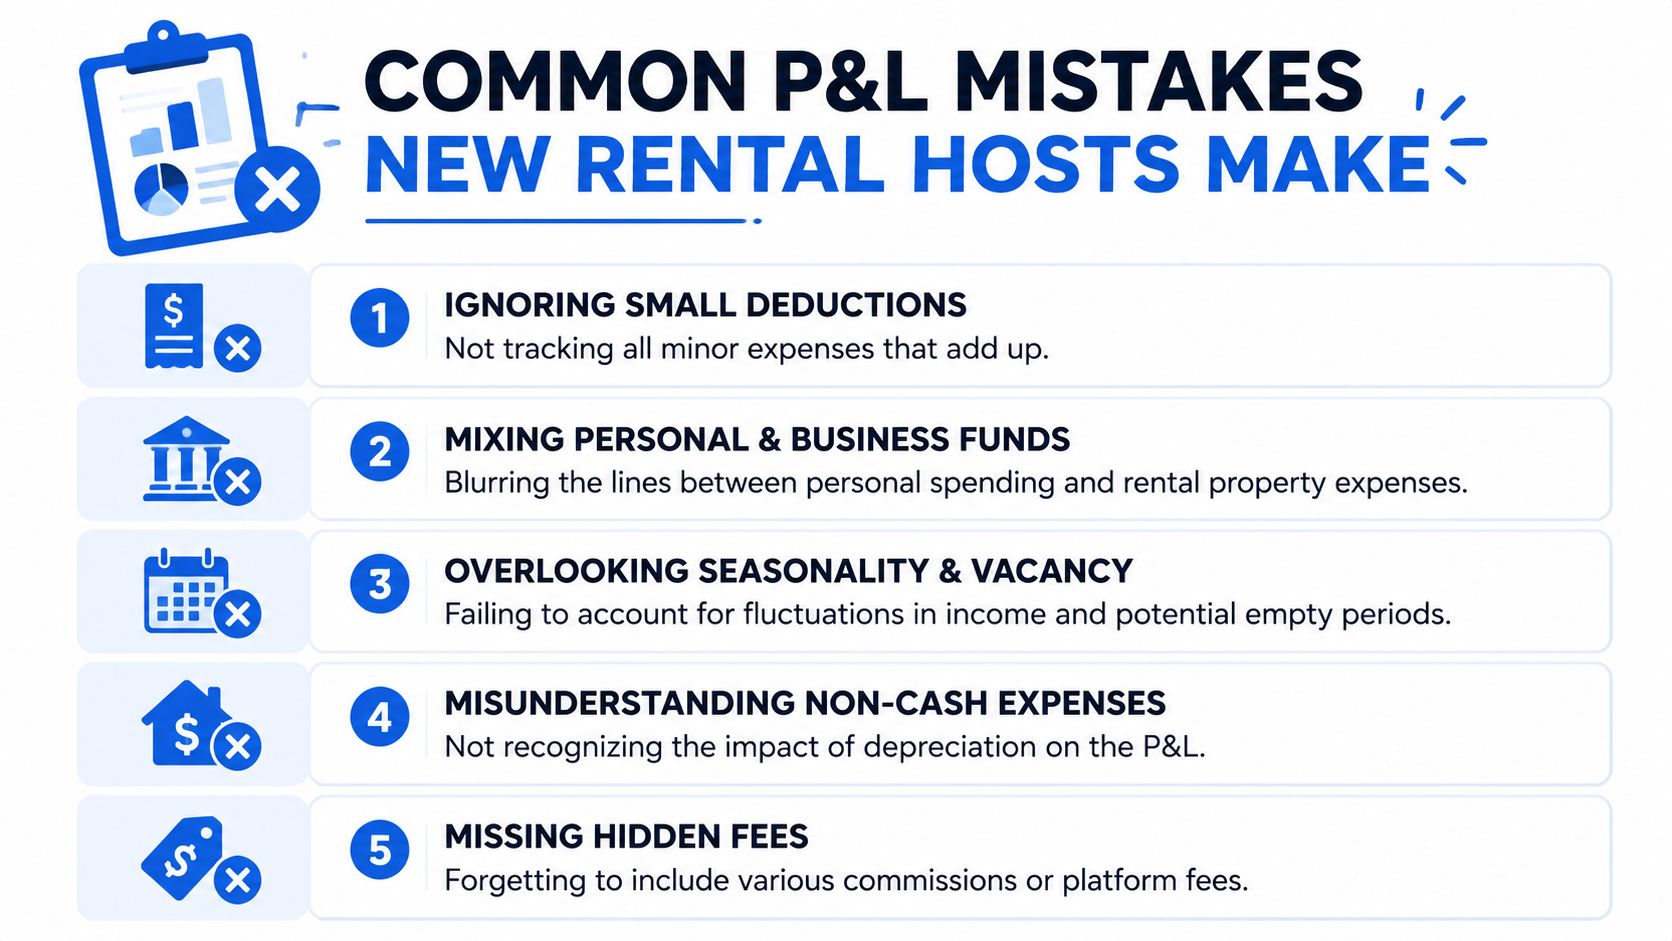
Vertical analysis means turning raw dollars into percentages. For a PadSplit or co-living house, that matters because a $900 utility bill means something very different in a 4-room property than it does in a 9-room property. Percentages let you compare them on equal footing.
For example, if House A collects $6,000 and spends $1,200 on utilities, utilities are 20% of collected rent. If House B collects $9,000 and spends $1,350, utilities are 15%. House B spent more dollars, but House A gave up more of its income to keep the lights on.
That changes the questions you ask.
- Utilities are running high as a percent of rent. Check HVAC settings, laundry usage, house rules, and whether room pricing is too low for an all-in utility model.
- Vacancy loss is taking a bigger bite than expected. Look at specific rooms, not just the house total. One weak room can drag down the whole property.
- Repairs are eating a bigger share of income. Separate turnover fixes from true maintenance so you can tell whether the problem is resident churn or the building itself.
- NOI margin is thin even with strong occupancy. Review bundled services, underpriced rooms, or labor-heavy operations that feel manageable day to day but insidiously drain cash.
A generic small business P&L will not show these room-level pressure points clearly. A rental host needs to know which bedroom, which house, and which cost bucket is reducing NOI.
Use horizontal analysis to catch trends early
Horizontal analysis means comparing one period to another. Month-over-month is usually the clearest view for hosts because pricing, occupancy, and turnover can shift fast in shared housing.
The goal is to explain change. If revenue stayed flat but NOI fell, expenses likely crept up. If revenue rose but profit barely moved, the added income may have been offset by vacancy turns, cleaning, or utility overuse.
| Line item | What to watch for over time |
|---|---|
| Collected rent | Whether pricing and occupancy are improving together |
| Vacancy loss | Repeated downtime in the same room or the same property |
| Utilities | Consumption rising faster than occupied rooms |
| Repairs and maintenance | Small recurring issues that keep showing up month after month |
| NOI | Whether operations are actually getting more efficient |
A simple operator question helps here: What changed this month?
If one room was empty longer than usual, your listing, photos, room setup, or price may need work. If utilities jumped in a fully occupied house, usage behavior may have changed. If maintenance spikes every time a room turns, your make-ready process may be weak.
Turn analysis into action
A P&L works like a dashboard for a host. You do not need twenty ratios. You need a short list of actions tied to the lines that move your bank balance.
Start with the biggest gap.
- One room keeps posting vacancy loss. Review that room's price against the rest of the house, inspect the furniture and photos, and check whether that room has a drawback you have not priced correctly.
- Utilities per occupied room keep climbing. Compare occupied-room count with the bill, inspect HVAC and water leaks, and tighten house expectations around space heaters, windows, and laundry habits.
- Turnover costs are rising. Break out cleaning, supplies, lock changes, and minor repairs so you can see whether move-outs are becoming more expensive or merely more frequent.
- A house has strong rent but weak NOI. Check for hidden drag from internet upgrades, consumables, lawn care, admin labor, or repeated minor fixes that look harmless alone but expensive in total.
Then review the result the next month. If the number improves, keep the change. If it does not, test the next likely cause. That is how experienced hosts use a P&L. Not as a filing document, but as a monthly operating tool for raising NOI across individual rooms and the full portfolio.
Common P&L Mistakes New Rental Hosts Make
Most bad P&Ls don't fail because the math is hard. They fail because the habits behind the numbers are sloppy.
For operating decisions, a monthly P&L is more useful than an annual-only report because it helps you spot revenue and expense variances earlier. The most actionable statements are built from reconciled bank transactions, receipts, and payroll records, according to QuickBooks' guide to profit and loss reporting.
Five mistakes that cause most of the confusion
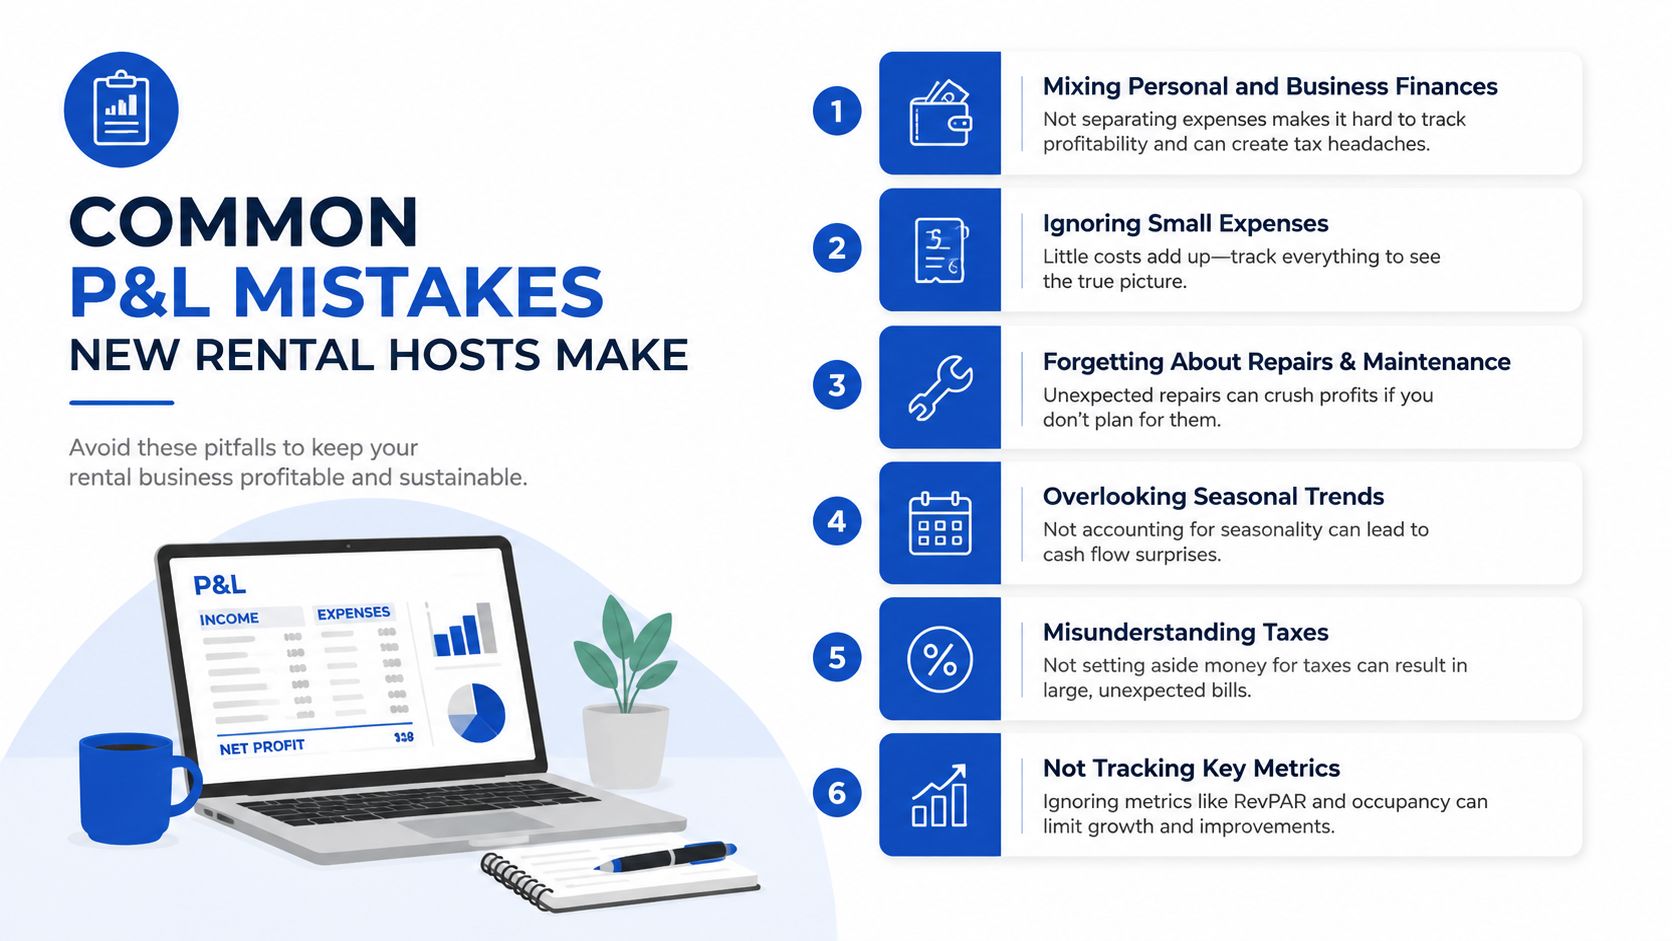
Mixing personal and property spending. If groceries, gas, or personal subscriptions are flowing through the same account as rental expenses, your P&L stops being trustworthy.
Dumping expenses into vague buckets. “Miscellaneous” becomes a junk drawer. If utilities, supplies, repairs, and turnover costs all live there, you can't diagnose anything.
Ignoring vacancy loss. Hosts often track the empty room operationally but not financially. That hides one of the biggest drivers of weak NOI.
Reviewing results too late. By the time you look once a year, the pattern is already old news. Monthly review gives you a chance to respond.
Skipping reconciliation. If the P&L doesn't tie back to actual bank, card, invoice, and payroll activity, it's only a rough draft.
What clean reporting looks like
A dependable rental P&L usually follows a simple rhythm:
- Pull transactions for the month.
- Match them to receipts, invoices, and payroll records.
- Categorize them the same way every month.
- Review variance by room, house, and portfolio.
- Fix coding errors before making decisions.
The best P&L is not the fanciest one. It's the one you trust enough to use.
A new host doesn't need perfect accounting architecture on day one. But they do need separation, consistency, and a monthly habit. Without those three things, every pricing or expense decision starts from blurry data.
Your P&L Template and Next Steps with PadPulse
If you want a starting point, keep your spreadsheet simple. A beginner-friendly P&L report example for room-by-room rentals can follow this outline:
Copy this basic template
| Section | Suggested line items |
|---|---|
| Revenue | Room rent, fees, other property income |
| Less direct costs | Vacancy loss, prorated utilities, cleaning, supplies, room-specific repairs, transaction fees |
| Property contribution | Revenue minus direct costs |
| Less operating expenses | Insurance, common area maintenance, admin, software, marketing, bookkeeping |
| NOI or operating income view | Property contribution minus operating expenses |
| Below operating line | Financing costs, taxes, depreciation, owner-specific items |
Keep the format consistent every month. That matters more than creating a complicated model.
Build it manually, then make it easier
A manual spreadsheet is still worth doing at least once. It forces you to understand the moving parts. You'll see how room revenue rolls up, how vacancy distorts results, and how overhead can eat into profit.
If you're comparing tools to streamline that work, this guide to the best accounting software for rental properties is a practical next read.
The long-term goal is simple. Spend less time rebuilding reports and more time using them. The hosts who grow well aren't guessing from bank activity. They're reviewing clean operating data and making faster calls on pricing, vacancy, utilities, and maintenance.
PadPulse is building an all-in-one platform for PadSplit hosts and co-living operators who want clearer financial visibility without stitching together spreadsheets, messaging tools, and smart-home systems. If you want updates on upcoming P&L tracking, portfolio analytics, and other rent-by-the-room tools, join the PadPulse interest list.