Profitability Analysis Guide for Room by Room Rentals
August 10, 2026
You can have steady bookings and still end the month feeling unsure about what's really working. Maybe one room keeps turning over fast, another sits empty longer than expected, and utilities, repairs, and shared expenses blur together until the house's real return feels hard to see. That's the point where profitability analysis becomes less like accounting jargon and more like a practical tool for making better decisions.
For room-by-room rentals, the numbers matter because a small shift in occupancy, pricing, or shared costs can change the whole picture. A simple monthly P&L won't tell you which room is carrying the property, which expense is eroding the margin, or whether your house is producing healthy returns for the capital tied up in it. A structured view helps you separate noise from signal and focus on the levers that improve NOI.
Introduction to Profitability Analysis
A host finishes month-end, opens the dashboard, and sees that bookings looked fine but cash feels tighter than expected. One room renewed quickly, another sat vacant longer than planned, and a few shared expenses landed all at once. The result is a familiar kind of anxiety, a property that appears busy but doesn't feel as profitable as it should.
That's where profitability analysis changes the conversation. Instead of asking only whether the house made money, you ask where the money came from, where it leaked out, and which rooms or costs deserve attention first. For a room-by-room rental, that shift matters because each room behaves a little differently, even when they share the same roof.
Profitability analysis converts a messy month into a clearer story. It helps you connect revenue, costs, and capital efficiency so you can see whether pricing, occupancy, or overhead is pulling the property forward or holding it back. In asset-heavy businesses, that connection is especially useful because the return on the building matters just as much as the monthly cash flow.
A good operator doesn't need more noise. They need a way to tell whether a strong-looking month was strong, or whether a few hidden cost lines masked a problem that will show up again next month.
Understanding Profitability Analysis
Think of profitability analysis like slicing a pizza into pieces you can name. One slice is revenue, another is direct cost, another is overhead, and the whole pizza is the business result. If you only look at the whole pie, you know dinner is there, but you don't know which slice is missing.
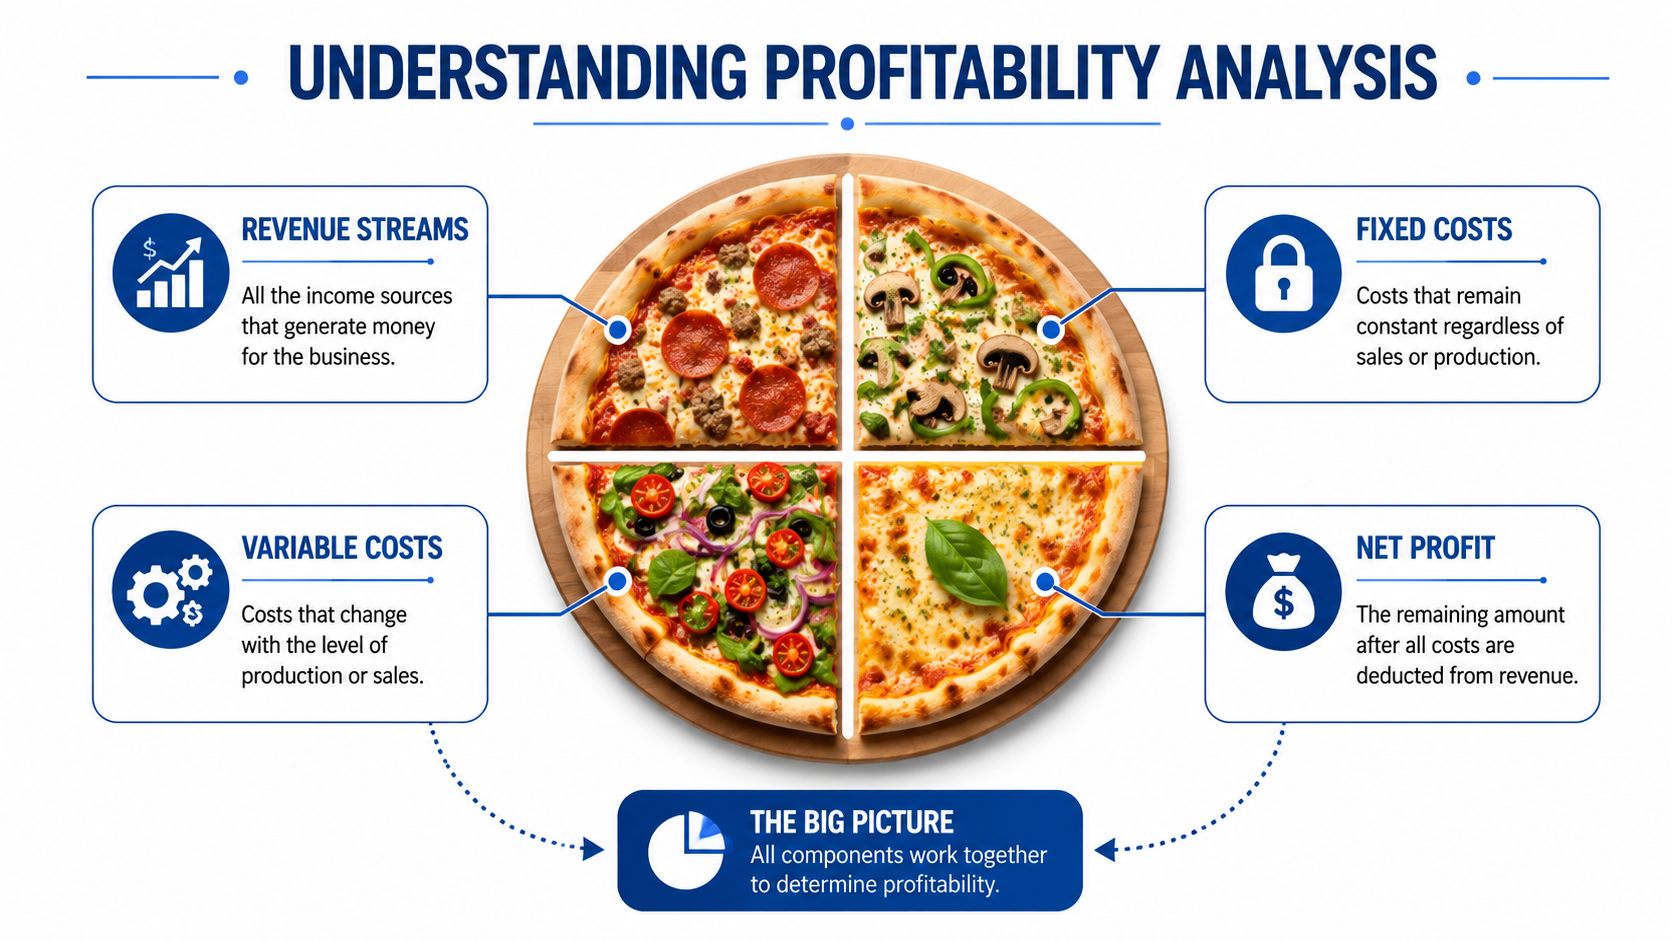
Why decomposition matters
Columbia Business School's 2023 teaching note describes profitability analysis as decomposing the book rate of return on common equity into components that isolate contributions from different business activities. That idea is useful far beyond a classroom because it keeps you from treating profit like one undifferentiated number. Instead, you separate the parts that create return from the parts that consume it, which is exactly what room-by-room operators need when different rooms, pricing choices, and shared expenses all affect the final result (Columbia Business School teaching note).
For a shared house, that means you can ask better questions. Is the issue weak pricing on one room, slower turnover, or a utility bill that belongs to the whole property? Is a room's strong top-line rent real profit, or does it disappear once cleaning, maintenance, and other shared costs are assigned properly?
Practical rule: If a room looks profitable only before overhead is assigned, don't call it truly profitable yet. First check whether the cost allocation matches how the house actually uses resources.
From bottom-line accounting to decision support
Modern profitability analysis didn't stay stuck at the bottom line. It evolved into a diagnostic system that helps operators see where profit is created or lost across products, segments, and assets. That's why it's useful in asset-intensive businesses like co-living, where small changes in occupancy, pricing, or cost structure can materially alter returns.
The value is not just historical. It's operational. Once you understand the drivers, you can budget more intelligently, price more confidently, and decide where to put capital next. In a room-by-room rental, that might mean giving one room a premium rate, tightening costs in another area, or rethinking whether a shared service should be allocated to the full house or only to specific rooms.
A simple mental model
Use this three-part lens when you review a property:
- Revenue drivers tell you how much income each room or bed generates.
- Cost drivers show what it takes to keep that room occupied and operating.
- Capital drivers reveal whether the return justifies the money tied up in the house.
That framework keeps you from confusing activity with performance. A full calendar isn't automatically a healthy business if the cost base is out of control or the returns on the property are weak.
Essential Metrics for Room Profitability
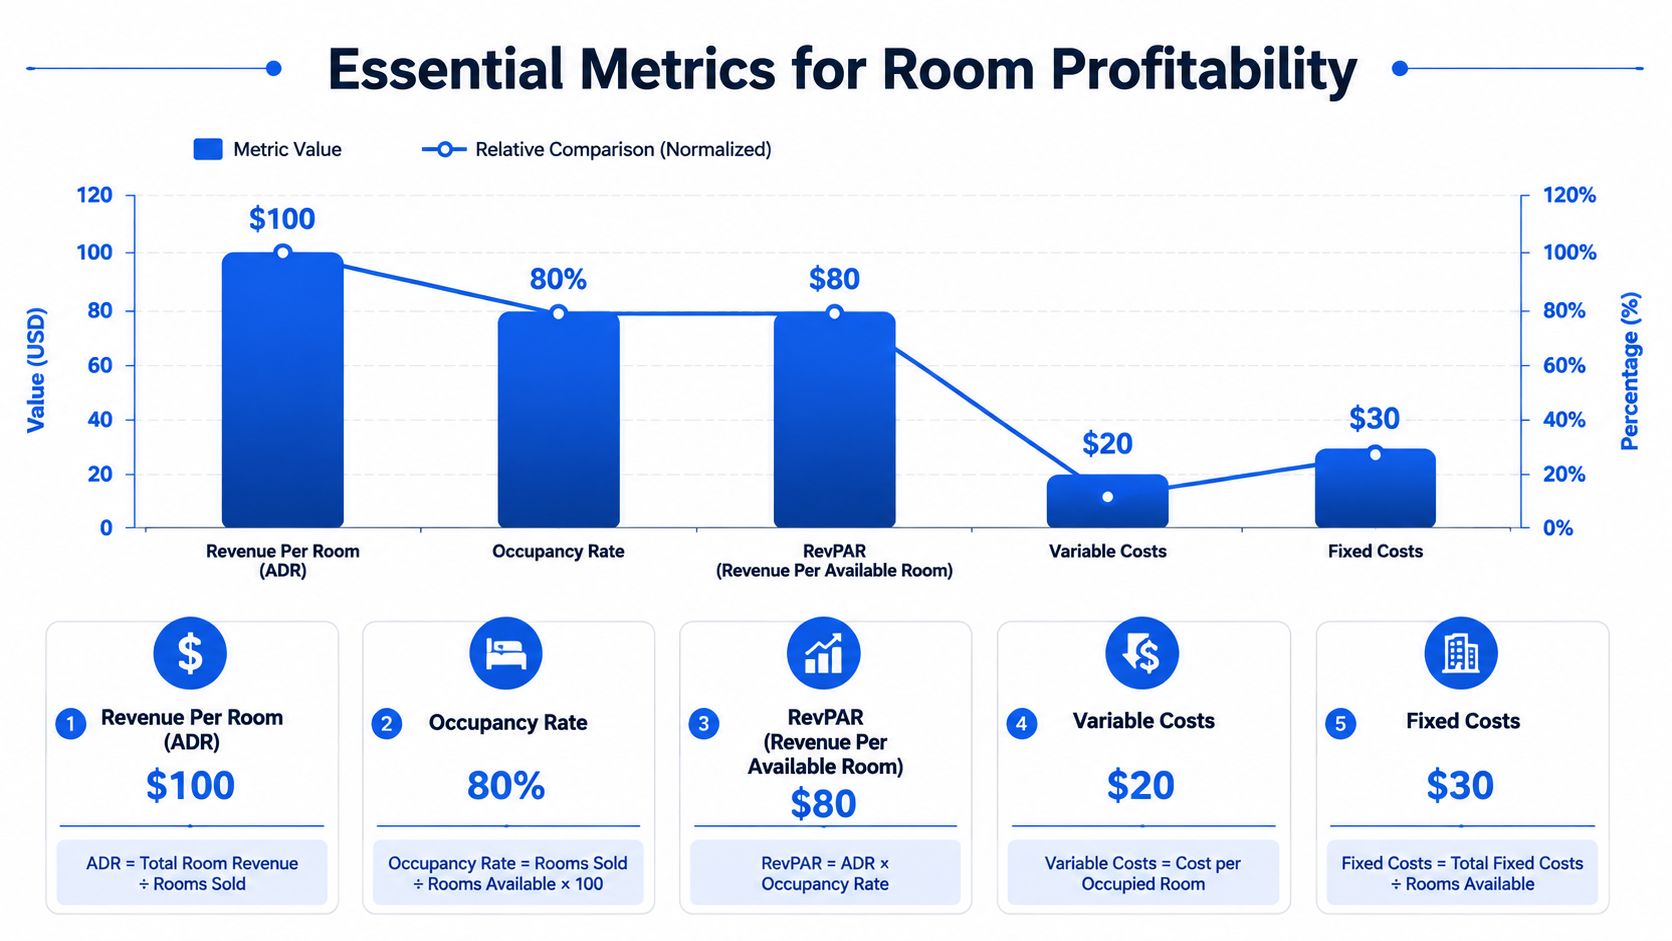
A profitable room-by-room property doesn't need dozens of metrics to start. It needs a small set that tells you whether revenue, occupancy, and costs are working together or fighting each other. The break-even and margin-based approach is widely used because it combines income statement data with ratio analysis to show whether a business is covering costs and generating acceptable returns (Fathom).
The core room-level numbers
For shared housing, the most useful starting metrics are straightforward:
- Revenue per room shows how much each room brings in over a period.
- Occupancy rate shows how often a room is filled.
- RevPAR, or revenue per available room, combines price and occupancy into one snapshot.
- Variable costs show what changes with usage or turnover.
- Fixed costs show what stays in place whether the room is full or empty.
These numbers matter because they tell different stories. A room with strong rent but weak occupancy may underperform a slightly cheaper room that stays filled longer. Another room may look efficient on rent alone, but cleaning, utilities, or maintenance can erode the result quickly.
How the metrics work together
A simple way to think about it is this. Revenue per room tells you the headline. Occupancy tells you how consistently the room contributes. RevPAR blends both, which makes it useful when you're comparing rooms with different turnover patterns. Then variable costs and fixed costs tell you what the revenue had to fight through before profit showed up.
A room-by-room operator can use these metrics in a spreadsheet without overcomplicating the process. If one room's rent rises but occupancy falls, the answer is not always “raise price again.” Sometimes the better move is to test a softer rate, improve lead flow, or reduce vacancy friction.
The most important point is that metrics only become useful when they're read together. A healthy top line can still hide an unhealthy structure if costs are rising faster than the room can support.
Net operating income explained for operators can help anchor this view, because NOI is where the room-level story eventually has to land.
Framework for Calculating Room Profitability
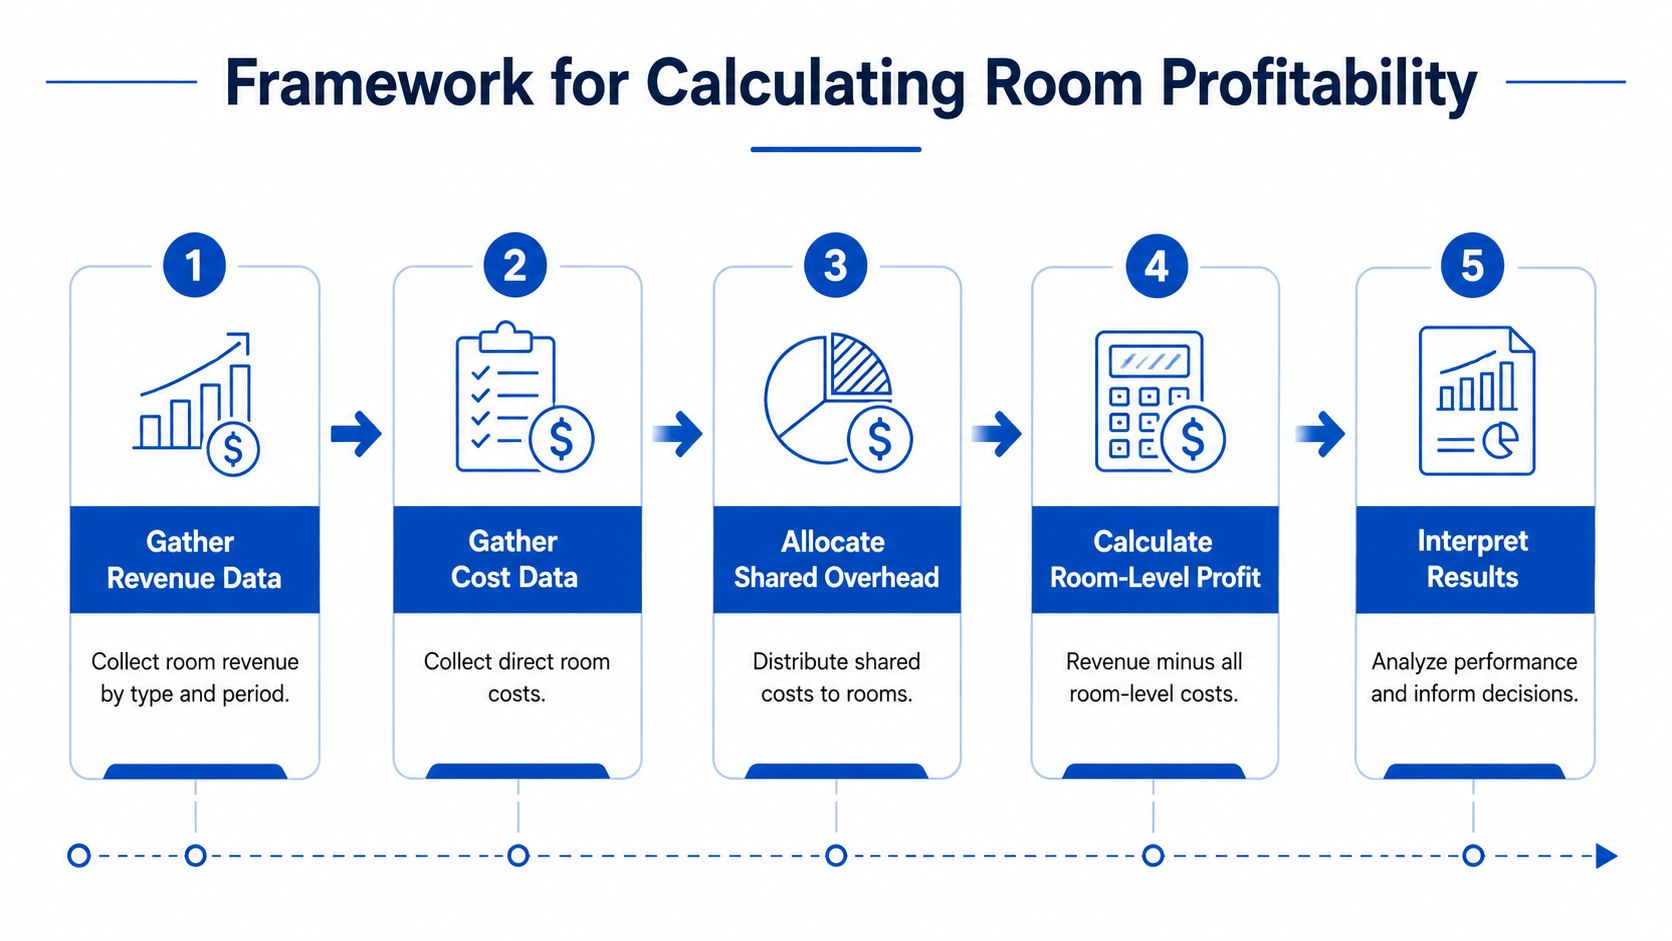
The cleanest way to calculate room profitability is to work from the room outward, then reconcile back to the house. Start with the revenue each room produces, then add the costs that belong directly to that room, and only after that deal with the shared expenses that support the whole property. That sequence keeps the math honest.
Step 1 Gather revenue data
Pull the rent charged for each room, any fee income tied to that room, and the dates those amounts applied. Don't mix booked revenue with collected revenue unless your spreadsheet is intentionally built that way. Consistency matters more than sophistication at this stage.
For a room-by-room rental, timing matters because turnover can distort the picture. A room that starts the month occupied but ends it vacant may still look strong if you only glance at the monthly headline. A simple room ledger helps avoid that mistake.
Step 2 Gather direct cost data
Direct costs are the ones you can reasonably connect to one room. That can include room-specific repairs, lock replacements, or special cleaning. If you can point to the room and say, “This expense happened because of this space,” it probably belongs here.
Many owners are tempted to oversimplify. Avoid this pitfall. One room may need more upkeep than another, and those differences matter when discerning true performance.
Step 3 Allocate shared overhead carefully
Shared costs are the harder part. Utilities, internet, lawn care, general maintenance, and marketing often support the full house, not one room alone. The goal is to assign them in a way that reflects actual resource use, not just convenience.
Practical rule: If a cost serves the entire property, allocate it with a method you can explain in one sentence. If you can't explain the logic, the allocation probably needs another look.
A contribution margin view helps. It shows what remains after direct costs, before fully loaded overhead. That extra lens matters because the “best” room on paper can look weaker after shared costs, while a strategically important room may still deserve support even if its fully loaded margin looks thin.
Step 4 Calculate room-level profit
Once revenue, direct costs, and allocated overhead are in place, calculate the room's profit. Then compare it across rooms. Don't stop at one month. A single period can mislead you, especially in properties where seasonality, turnover, or lease timing affects results.
Step 5 Reconcile to house-level NOI
After the room-level numbers are in place, add them back up and compare them with house-level results. If they don't tie, don't ignore the gap. It usually means one of three things, a cost was missed, an allocation method is inconsistent, or the property has income and expense lines that were never assigned to rooms at all.
A frequent challenge is overhead-heavy allocation when margins are thin or volume-sensitive. Properly assigning indirect costs reveals which segments are profitable versus merely high-revenue, which is why a fully loaded view and a contribution view both deserve a place in the spreadsheet (Farseer).
Real-World Examples and Spreadsheet Templates
A spreadsheet doesn't need to be complicated to be useful. For room-by-room rentals, the best template is usually one that shows the same house from two angles, the current month's baseline and a simple what-if view. That lets you test pricing or occupancy changes before you commit to them.
A four-bed pad and a six-bed co-living house
Start with a four-bed pad. List each room on its own row, then add columns for rent, occupancy status, direct costs, and allocated shared costs. The point isn't to build a perfect accounting model. It's to make the profit drivers visible enough that you can compare room performance side by side.
Then repeat the same structure for a six-bed co-living house. This time, you may notice that a room with modest rent still contributes well because it stays full and carries little extra cost. Another room may produce stronger revenue but demand more attention, more cleaning, or more repair work.
That contrast is the value of the template. It stops you from treating every room as interchangeable.
A useful spreadsheet habit is to keep one tab for actuals and one tab for scenarios. That way, you can test pricing changes without overwriting the numbers that came from the real month.
Sensitivity templates that actually help
Simple sensitivity tests are enough for most operators. Try one variable at a time so the result stays readable.
Use questions like these:
- Occupancy drop test: What happens to room profit if a room sits vacant longer than usual?
- Price increase test: What happens if the room rate moves up and occupancy stays stable?
- Cost increase test: What happens if utilities or cleaning rise and you keep pricing the same?
A sensitivity table makes these tradeoffs easier to read. If a small occupancy drop wipes out most of the gain from a rate increase, that's a warning signal. If a modest price increase barely moves occupancy but improves room profit, that's useful evidence for repricing.
For a clean reporting format, the example P&L layout for room-by-room rentals can serve as a reference point when you build your own workbook. Keep the structure simple enough that you'll use it every month.
The best template is the one that gets opened. If the workbook is too complex, it won't survive contact with real operations.
Benchmarks for PadSplit Style Rentals
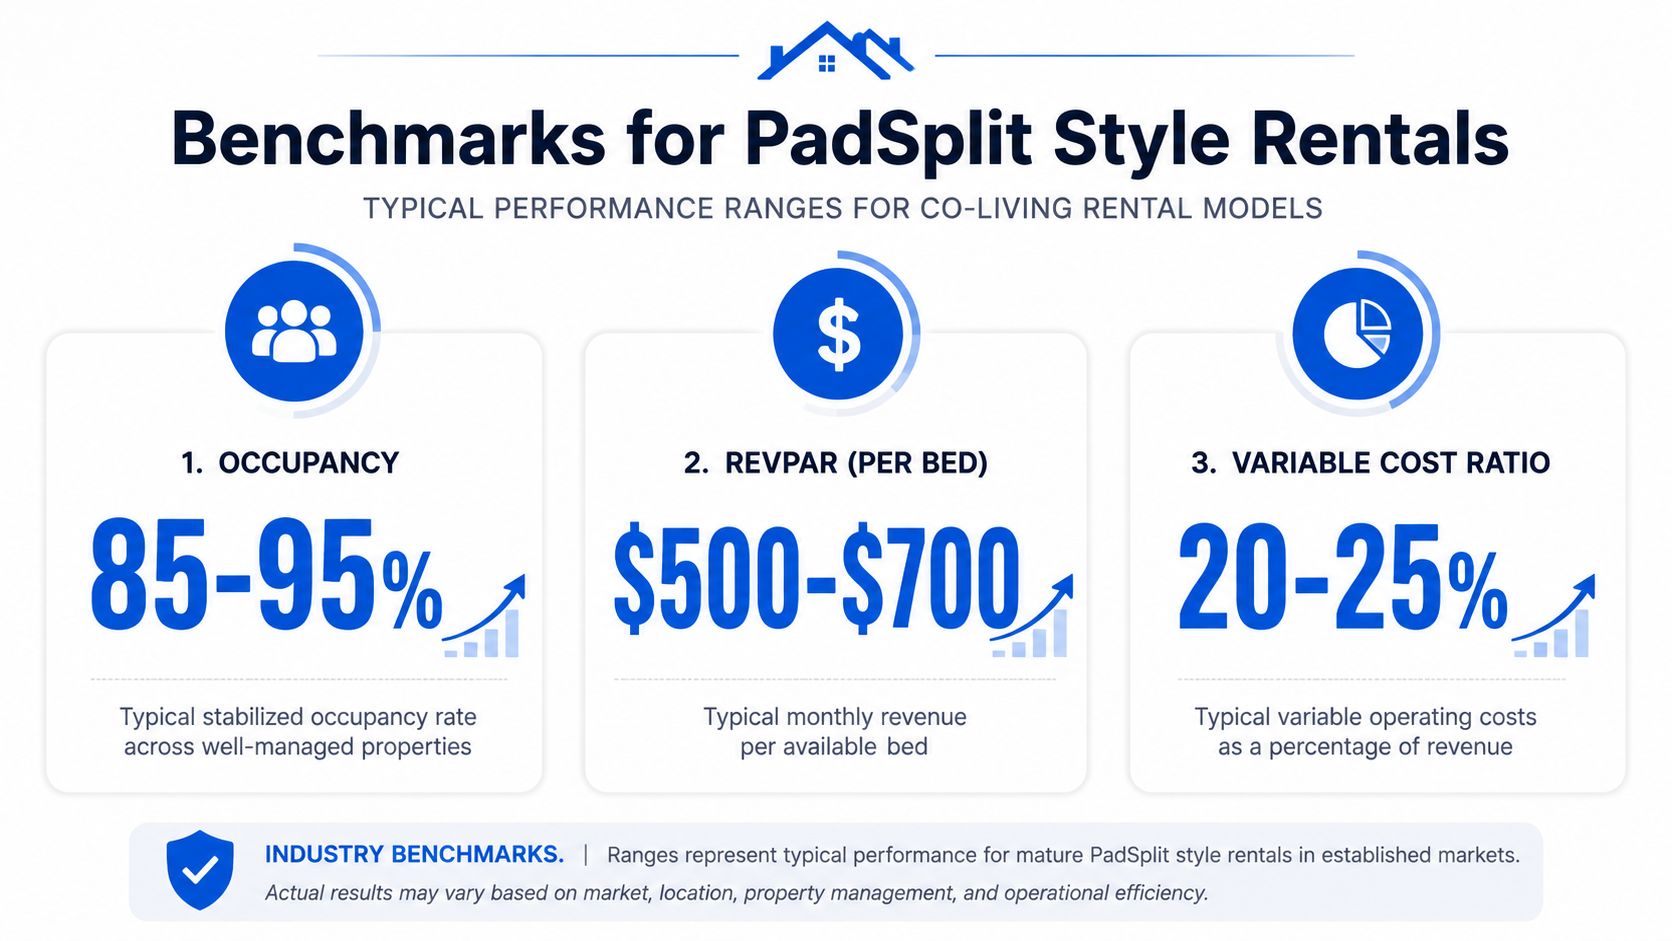
Benchmarks help you answer a question that raw numbers can't answer on their own. Is this property performing well for a shared housing model, or is it just doing better than a bad month? For PadSplit-style rentals, the most useful comparisons are occupancy, RevPAR per bed, variable cost ratio, and NOI margin, because those figures speak directly to occupancy efficiency, pricing power, and operating discipline.
Useful reference ranges
A common benchmark set for PadSplit-style co-living models is 85 to 95 percent occupancy, $500 to $700 RevPAR per bed, 20 to 25 percent variable cost ratio, and 25 to 35 percent NOI margins. Those ranges give operators a practical yardstick for where a house sits relative to peers.
A property below the occupancy band may need better pricing, better lead flow, or lower vacancy friction. A house with decent occupancy but weak RevPAR per bed may be underpricing rooms or giving away too much through concessions. If variable costs drift high, the issue is usually less about revenue and more about operational discipline.
How to interpret gaps
Benchmarks are not verdicts. They're prompts.
- Below occupancy range: Review pricing, lead response, and move-in friction.
- Below RevPAR range: Check whether room rates match demand and room quality.
- Above variable cost ratio: Look for waste in cleaning, utilities, supplies, or maintenance routing.
- Below NOI margin range: Reconcile the house-level cost structure, then inspect the room-level allocation.
Property type and geography matter too. A dense urban market can support a different operating profile than a suburban house, and smaller homes don't always behave like larger co-living assets. Use the benchmark as a guide, then adjust for local demand, room quality, and house configuration.
One mistake is using a single benchmark to judge every room. Another is treating a good occupancy rate as proof of strong profitability. A room can stay full and still underperform if the cost to serve it is too high or the rent is too low.
Tactical Recommendations for Improving Profitability
The quickest improvements usually come from four levers, pricing, vacancy, cost control, and smart-home efficiency. None of them work in isolation, and none replaces disciplined measurement. Used together, they give a room-by-room operator a better shot at improving NOI without guessing.
Pricing should move with demand
Dynamic pricing matters because rooms don't all sell the same way. A room with steady inquiries can often support a higher rate, while another may need a lighter touch to keep occupancy healthy. Repricing works best when it follows actual demand signals instead of a fixed annual assumption.
A strong pricing process protects both sides of the equation, revenue and occupancy. If you want a broader framework for that balance, revenue optimization for shared housing is the right mental model. The goal isn't to raise prices everywhere. It's to ask where the market will pay more without creating unnecessary vacancy.
Vacancy reduction starts before move-out
Empty rooms are expensive because they don't just lose rent, they keep consuming attention. The operators who reduce vacancy fastest usually focus on lead response, simple move-in steps, and retention before a resident even thinks about leaving.
Good vacancy control often comes from basic execution. Faster replies, clearer listing photos, and easier move-ins tend to do more than elaborate marketing plans. If the house feels easy to join, more prospects make it to move-in.
Cost control works best when it's specific
Shared housing usually leaks money through ordinary items, not dramatic failures. Vendor contracts, supplies, maintenance scheduling, and energy usage all deserve review because they affect the property every month. A cost line that looks small in isolation can still matter when it repeats across the whole house.
Focus first on the costs that are recurring and controllable. Then check whether the same work is being done twice, or whether a vendor relationship is still the best fit. Tight cost control is less about cutting blindly and more about removing waste that doesn't improve the resident experience.
Smart-home tools can reduce friction
Keyless locks and smart thermostats do more than add convenience. They reduce manual coordination, help standardize access, and make it easier to manage usage across a shared property. In a room-by-room rental, that can mean less labor time spent on entry issues and better control over comfort-related costs.
The practical advantage is consistency. Houses run smoother when access and temperature don't depend on repeated manual intervention. That doesn't replace good management, but it does remove small operational headaches that otherwise pile up.
Conclusion and Key Takeaways
Profitability analysis gives room-by-room operators a way to see past the monthly headline and into the underlying drivers of return. The most useful habit is simple, measure room revenue, assign direct costs carefully, allocate shared overhead with a defensible method, and compare the result against house-level NOI. That structure turns a confusing month into a usable decision tool.
The biggest wins usually come from the same place, better pricing, better vacancy control, cleaner cost allocation, and a willingness to test scenarios before making changes. Benchmarks help you judge where you stand, but the spreadsheet is what tells you where to act. If you start with one property and one monthly cycle, you'll learn faster than if you wait for the perfect model.
Download or build a simple template, run the numbers for your next house, and test at least one pricing or cost change this month. Small, consistent improvements matter more than waiting for a perfect analysis.
PadPulse is building an all-in-one platform for room-by-room operators who want clearer pricing, stronger reporting, and less manual work across the portfolio. If you're ready to tighten your profitability analysis and manage co-living houses with more confidence, visit PadPulse and join the early adopter list for updates and limited beta access.