Return on Investment Calculator for Co-Living Operators
August 5, 2026
You finally walk the same house after a full year and wonder why the math looked so good in the spreadsheet. On paper, both properties were “profitable.” In real life, one felt smooth and the other felt like it leaked money through vacancies, turnover, repairs, and a few expensive decisions that looked small at the time.
That gap is why a return on investment calculator matters for co-living operators, but only if you use it the right way. A simple headline ROI number can hide timing issues, recurring costs, and the difference between a fast-payback rooming house and a slow-payback upgrade that ties up cash for too long. The better habit is to treat ROI like an operating tool, not a verdict.
Why Two Profitable Houses Can Feel Like a Loss
One of the easiest mistakes in shared housing is to compare two houses by rent roll alone. You might look at a six-room property with steady occupancy and another house with higher sticker rent, then assume the second one wins. A year later, the first house may have produced the better result because it turned faster, needed less handholding, and kept cash moving.
The same problem shows up when hosts rely on a single percentage and skip the details underneath it. A higher ROI can still be the weaker deal if the money stays locked up longer or the payback arrives too late. That's especially important when the loan schedule, renovation timeline, or operating burden changes the actual pace of recovery.
Why the headline number misleads
A plain ROI percentage answers one narrow question, how much return you got relative to what you spent. It doesn't automatically tell you when the cash came back, whether the result includes vacancy, or whether the house needed recurring work to keep the rooms full. That's why time-aware ROI and annualized ROI matter so much for room-by-room rentals, where the operating rhythm is never static.
Practical rule: If two deals show similar ROI but one pays back much later, treat them as different assets, not equal wins.
That mindset is also why mainstream calculator guides now push users to provide dates or holding periods, and why tools increasingly expose annualized ROI instead of only a single percentage. The basic calculator is still useful, but the decision gets better when you can compare investments on the same time scale. If you've ever wondered why one house “felt” better than another even with a similar percentage return, this is usually the reason.
The Core ROI Formula in Plain English
The core formula is simple enough to memorize: ROI = (Gain from Investment - Cost of Investment) / Cost of Investment. After you calculate that ratio, you multiply by 100 to express it as a percentage. That's the version beginners should keep in their head because it turns a messy rental deal into one clear comparison point, even if the deal still needs deeper analysis.
Let's use a room-by-room example. Say you spend money on a shared house, and after all the income and expenses are tallied, you end up with $7,500 of gain on $50,000 of cost. The math is ($7,500 ÷ $50,000) x 100 = 15% ROI. That doesn't mean the house is automatically great, it just means each dollar invested produced fifteen cents of gain under the assumptions you used.
The three pieces that matter
| Metric | What It Measures | Best Used When |
|---|---|---|
| ROI | Return relative to total cost | You want a simple profitability snapshot |
| NOI | Income left after operating expenses | You want to understand house-level cash flow |
| Cap rate | Property income relative to value | You're comparing buildings or acquisition prices |
| Cash-on-cash return | Cash flow relative to cash invested | You financed the deal and care about equity returns |
For hosts, these metrics are siblings, not replacements. ROI tells you whether the whole investment was worthwhile. NOI and cap rate help you understand operating strength, and cash-on-cash return gives more context when debt is involved. If you want a deeper grounding in NOI, the internal overview on what net operating income means is a useful companion.
ROI is a comparison tool first. It becomes a decision tool only when the costs and timing behind it are honest.
What a Reliable ROI Calculator Must Ask You
A thin calculator usually asks for one or two inputs, then gives you a polished number. That's convenient, but it's also where many operators get misled. For co-living, the answer depends on more than purchase price and final value, because the house is a living business with recurring turnover, utility pressure, and management time.
A better calculator asks for the full set of costs that touch the project. That includes setup fees, ongoing operating costs, financing expenses, and the value of time you and your team spend running the house. In real estate-like investments, ROI gets distorted fast if hidden expenses never make it into the denominator.
The inputs a serious tool should collect
For room-by-room rentals, look for fields that reflect the operating model:
- Total purchase price, including closing costs and other acquisition expenses.
- Down payment and loan details, because interest affects real returns.
- Monthly rental income, based on realistic occupancy, not peak-case optimism.
- Vacancy and turnover assumptions, because rooms don't stay full forever.
- Operating expenses, such as taxes, insurance, maintenance, and management.
- Per-room rent and utility markup, since shared housing depends on room-level pricing.
- Cleaning turnover costs, especially if you move members often.
- Smart-lock install cost and HVAC monitoring fees, if you use them.
- Staff time and internal labor, because your hours have value even when no invoice shows up.
Plainspoken test: If a calculator can't show where maintenance, vacancy, and financing fit, it's giving you a marketing number, not an operating number.
The best tools don't stop at a single field pair. They let you compare a thin version of the deal against a fuller version, so you can see how much the answer changes when real costs enter the model. That's the difference between “this looks good” and “this will still look good after six months of turns, repairs, and financing.”
A Walkthrough With a Real Co-Living Scenario
A six-bedroom house gives you a useful test case because the math is small enough to follow and messy enough to reflect real operations. One version uses standard locks, manual pricing, and no added monitoring. The other adds smart locks, a smart thermostat, and dynamic pricing, so the upfront check is larger but the day-to-day work is lighter.
Start with the baseline house. Count annual room revenue, then subtract vacancy, operating expenses, and any one-time setup costs you want included in the analysis. If the house looks profitable at the top line but loses income through empty rooms or heavy turnover, the return can fall fast once the full cost picture is in place.
Baseline versus upgraded house
The upgraded version changes the math in two places. It can raise room revenue through tighter pricing discipline, especially when demand shifts by season or neighborhood. It can also reduce turnover friction because smart access and HVAC control remove small operational headaches that pile up across the year.
A simple way to compare the two is to build the same worksheet twice, and a P&L report example can help you structure that comparison.
- Baseline house: Use current room rent, current vacancy, and current operating costs.
- Upgraded house: Add the smart-lock cost, thermostat cost, and any pricing tool expense.
- Compare net gain: Subtract all costs from total income in both versions.
- Check payback: See how long the added investment takes to earn itself back.
If the upgraded house produces a better annual return but the upfront spend is much larger, the question is whether that extra cash stays tied up too long. Annualized thinking helps here. A smaller gain that arrives sooner can be better than a larger gain that arrives later, especially when you are scaling across multiple doors and need cash available for the next acquisition.
A simple P&L-style view keeps the analysis grounded. A room rent calculator mindset helps because each room contributes differently, and the house only works when the sum of all rooms covers the full burden of running the property. When the pricing system, the access system, and the HVAC system work together, the house often becomes easier to manage even before the spreadsheet shows the full effect.
Mistakes That Make ROI Look Better Than Reality
The biggest ROI mistake is leaving out costs that feel inconvenient. Vacancy is the classic one, but it's only the start. If you ignore turnover labor, financing interest, maintenance, or internal time, the result can look attractive while the actual business model struggles.
Another common trap is confusing gross rent with true operating performance. Gross rent is the top line, but the house still has to survive the bills underneath it. That's why generic calculators that only show “initial investment” and “final value” can be dangerous for hosts who run tight margins.
Red flags to watch for
- Vacancy left out, which makes the deal look fuller than it really is.
- Loan interest ignored, even though debt is a real cost.
- Appreciation counted twice, once in the sale value and again in the return estimate.
- Tax benefits treated like guarantees, which they aren't.
- Gross rent mistaken for NOI, which hides the operating burden.
The time issue matters just as much as the cost issue. In the medical ROI toolkit, the logic is blunt, the payback period has to be shorter than the amortization period if you want a financial benefit. That idea translates well to co-living. A positive ROI on paper doesn't help much if the loan clock outruns the cash recovery, because you can still end up exposed to downside before the investment has earned itself back.
If the calculator never mentions payback period, ask what happens when the cash comes back slowly.
The cleanest way to audit any ROI output is to ask, “What did they assume away?” If the answer includes vacancy, financing, operating cost, and time, you're looking at something closer to a real decision model. If not, you're looking at a pitch deck number.
Turning ROI Numbers Into Pricing and Upgrade Decisions
ROI becomes useful the moment it starts changing decisions. For a co-living host, that usually means three levers, pricing, upgrades, and where to put the next dollar across the portfolio. If one room keeps filling fast while another lingers empty, pricing stops being a branding choice and starts looking like a capital allocation decision.
Start with pricing, because it is the fastest lever to test. Room demand can move by neighborhood, season, and amenities, so the right rate for one room can be wrong for the unit next door. A calculator helps you test whether a small rent change improves total return after vacancy and turn costs are included, instead of chasing a higher listed rent that never clears.
A room-rent model is especially helpful here, because it shows how one pricing move affects the whole house, not just the sticker price on one bedroom. If a slight increase lifts revenue but also leaves a room vacant longer, the return can flatten out. A simple room rent calculator keeps that tradeoff visible before you change the listing.
How upgrades compete with each other
Smart locks, HVAC upgrades, and kitchen refreshes all compete for the same cash. The best choice is not always the one with the flashiest feature. It is the one that improves return with the least drag on operations and the fastest believable payback.
A practical ranking method looks like this:
- Smart locks: Prioritize when access friction, lockouts, or vendor visits are slowing turns.
- HVAC controls: Prioritize when energy waste, comfort complaints, or monitoring gaps are hurting occupancy.
- Kitchen refresh: Prioritize when visual appeal is limiting room demand or member retention.
The same logic applies to the portfolio. Houses with strong NOI and clean ROI trends deserve more capital, while weaker ones need a pricing reset, an expense reset, or a pause on extra spending. That is how operators stop guessing and start managing by evidence.
When teams compare houses side by side, they are really asking which property deserves the next dollar. A decent calculator will not make the decision for you, but it will keep the discussion honest by forcing each option to compete on the same return logic.
A Quick Sensitivity Check Before You Spend a Dollar
A good ROI number should survive a few hard questions. Before you buy a lock system, approve an HVAC upgrade, or raise room prices, flex the assumptions and see what changes. If the answer falls apart under small shifts, the deal probably wasn't strong to begin with.
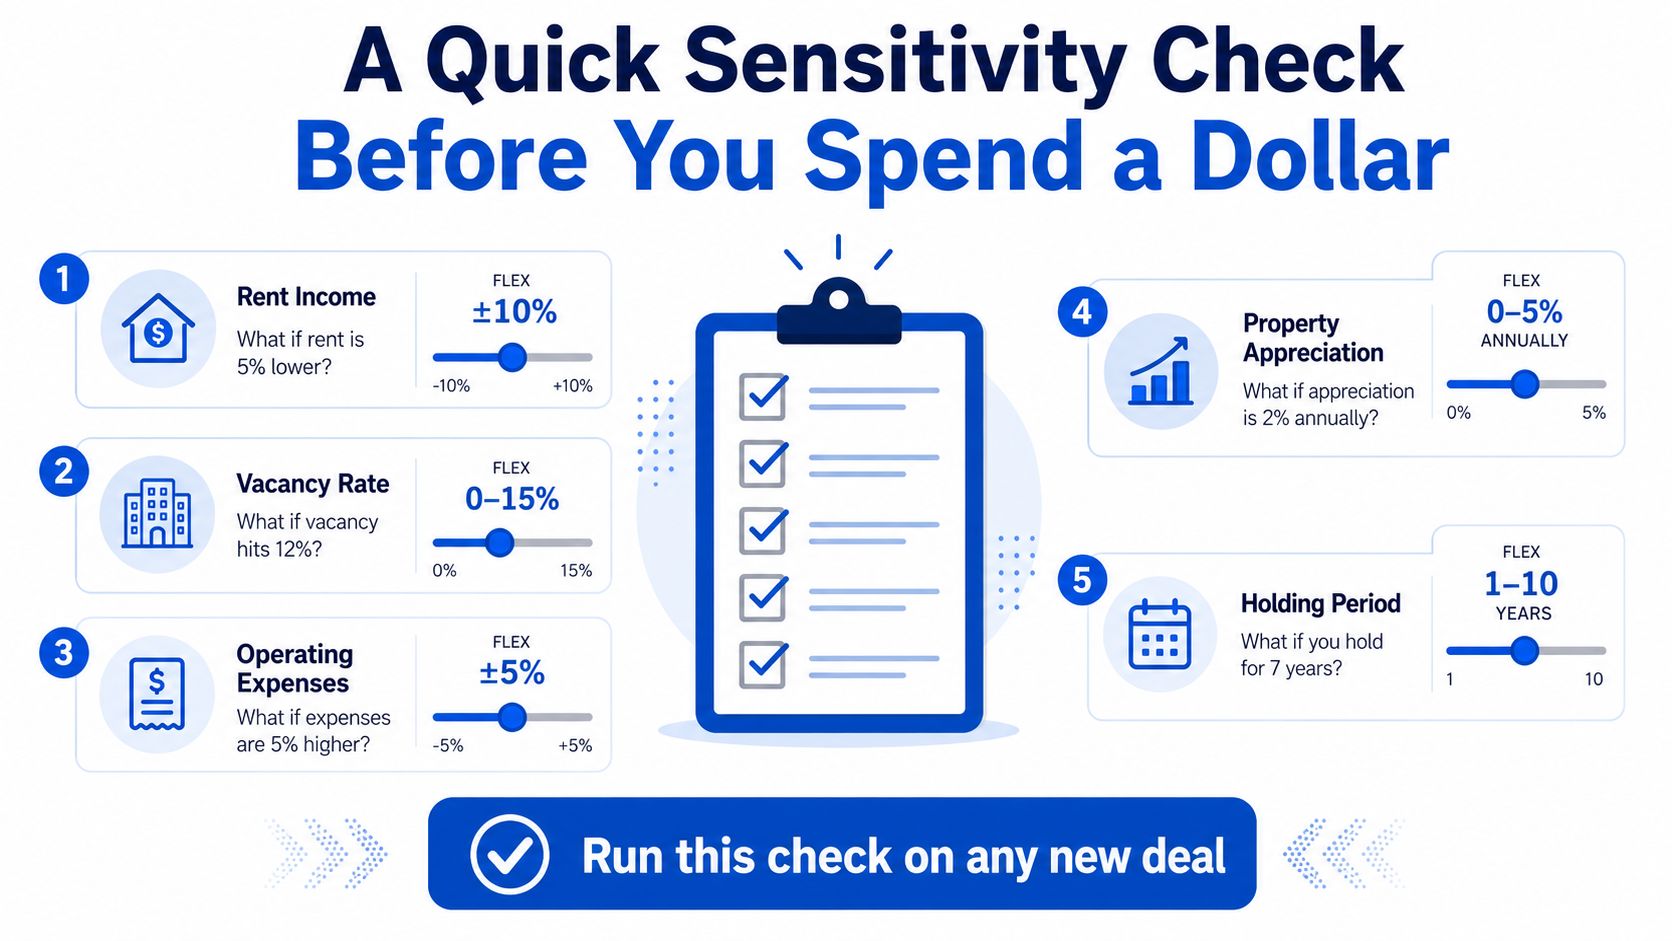
The easiest routine is to test five variables, rent, vacancy, operating expenses, appreciation, and holding period. Move each one a little lower or higher and watch how the ROI and payback picture changes. That gives you a range of outcomes instead of a false sense of certainty from one neat percentage.
A simple host routine
- Lower rent a little. Ask what happens if one or two rooms lease below your target.
- Raise vacancy a little. See whether one empty room breaks the return.
- Increase expenses slightly. Check how repairs or utilities affect the result.
- Shorten the hold. Test whether the investment still works if you exit earlier.
- Stretch the hold. See whether patience improves the outcome or just delays recovery.
This is the habit that protects operators from expensive optimism. A deal that only works under perfect conditions isn't a strong deal, it's a fragile one. A deal that stays healthy across a few different scenarios deserves much more confidence.
PadPulse is built for operators who want this kind of analysis without rebuilding spreadsheets every week. If you run co-living houses and want clearer pricing, smarter operating decisions, and better visibility into ROI, visit PadPulse and join the interest list for early access.