Rate of Occupancy in Pad-Style Rentals: A Host's Guide
September 26, 2026
You're looking at a six-bedroom pad with one room empty. The house may feel almost full, but that vacancy still removes one income-producing space from your operation. If the remaining rooms are occupied, your headline number might look strong, while your monthly cash flow tells a less comfortable story.
That's why rate of occupancy deserves more attention than a quick glance at your rent roll. It tells you how much of the capacity you could sell is currently producing income. It doesn't tell you whether the occupied rooms carry the strongest rents, whether utility costs are under control, or whether your net operating income is improving.
This guide starts with the basic formula, then moves into the details that matter in shared housing: sellable rooms, beds, tenants, comparison benchmarks, seasonal patterns, and the trade-off between filling space and protecting rate.
Why the Rate of Occupancy Matters for Your Pad
A host can manage a house that appears healthy on paper and still feel pressure every month. Five rooms in a six-bedroom property may be occupied, but the sixth room still needs marketing, showings, cleaning, and follow-up. Meanwhile, fixed costs continue whether the room earns rent or not.
The rate of occupancy gives you a quick view of how much usable capacity is occupied. In hospitality and real estate, it's a utilization ratio: occupied rooms or units divided by rooms or units available, multiplied by 100. That makes it a demand signal, not a revenue metric, as explained in this hotel occupancy KPI overview.

Suppose your six-bedroom house has five occupied rooms. Your room occupancy is:
5 occupied rooms ÷ 6 sellable rooms × 100 = 83.3%
That number is useful, but it isn't the whole story. If the empty room is your largest room, or if it supports several beds while the occupied rooms hold only one tenant each, the effect on income can be much greater than the percentage suggests.
Core idea: Occupancy measures how much capacity is being used. Revenue and NOI measure what that capacity contributes financially.
The number becomes useful when you compare it
A single occupancy reading is a snapshot. You need comparisons to make decisions:
- Against your own history, to see whether demand is improving or weakening.
- Against similar shared-housing properties, to understand your fair share of local demand.
- Against your rent and cost data, to determine whether added occupancy is helping NOI.
- Across rooms, beds, and tenants, because shared housing can produce very different answers depending on what you count.
By the end, you should be able to calculate the rate correctly, select a denominator that reflects what you can rent today, and decide whether to adjust price, improve the listing, or accept a vacancy rather than cut rent too far.
How to Calculate the Rate of Occupancy
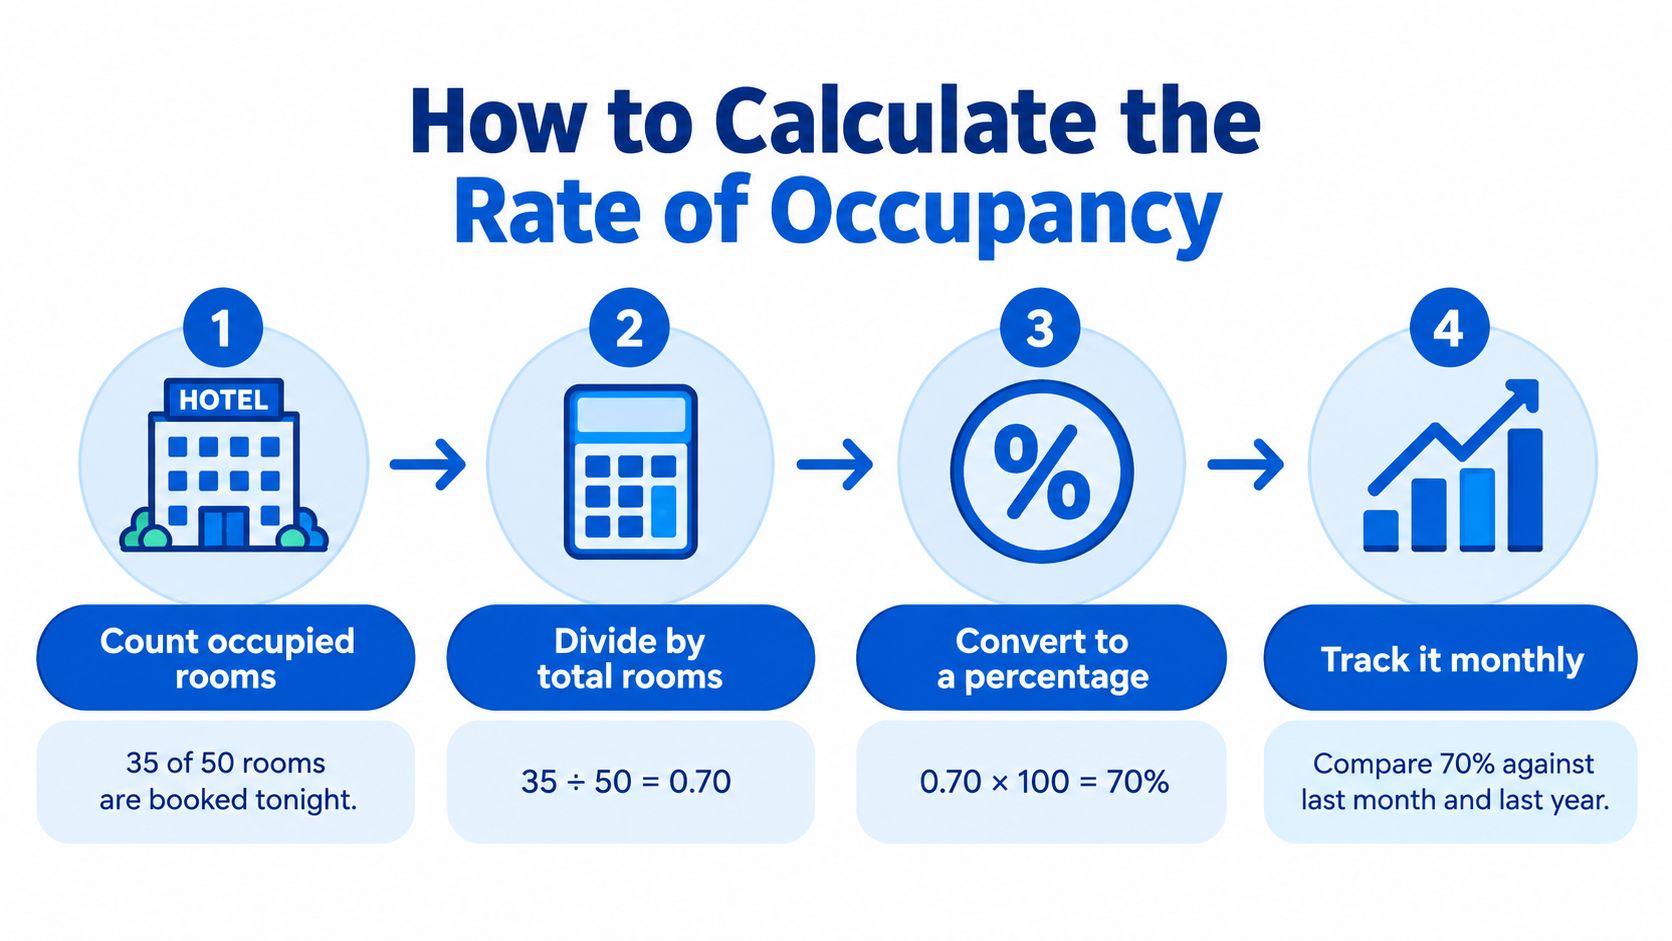
The standard calculation is simple:
Rate of occupancy = occupied rooms or units ÷ available rooms or units × 100
A familiar example is a 50-room hotel with 35 occupied rooms. The calculation is 35 ÷ 50 × 100 = 70% occupancy, which matches the example in this occupancy rate formula guide.
Think of the property as a concert venue. The number of occupied rooms is the number of tickets sold. The available rooms are the seats you could sell. A venue with 35 people in 50 sellable seats is 70% full, even if the unsold seats are spread across the building.
Apply the formula to a pad-style rental
For a six-bedroom house with five occupied rooms:
- Count the occupied rooms: 5.
- Count the rooms available for rent: 6.
- Divide occupied rooms by available rooms: 5 ÷ 6.
- Multiply by 100: 83.3%.
If the property is sold by bed instead, use beds as the unit of measurement. An eight-bed property with six beds filled has a bed occupancy rate of 6 ÷ 8 × 100. That produces 75% bed occupancy.
The denominator must match the inventory you're analyzing. Don't divide occupied beds by total bedrooms, or occupied rooms by every room in the building, if some spaces aren't offered to residents.
You can calculate occupancy over different periods:
- One night, useful for a daily operating view.
- One week, useful for spotting short-term booking movement.
- One month, useful for rent-roll and cash-flow reviews.
- A season, useful for comparing recurring demand patterns.
- A full year, useful for portfolio planning and property evaluation.
A monthly view helps you connect occupancy with collections, turnover, and operating costs. A trailing-90-day view can be even more helpful for a room-by-room operator because it smooths out one move-out or one unusually strong leasing week without hiding a sustained change in demand.
For a deeper look at the income your rooms could generate before vacancies, review this guide to gross potential rent.
Practice with quick calculations
- Four occupied rooms in a five-room house: 4 ÷ 5 × 100.
- Seven occupied beds in a ten-bed property: 7 ÷ 10 × 100.
- Three occupied rooms in a four-room property: 3 ÷ 4 × 100.
The arithmetic takes seconds. The harder question is deciding whether the available inventory count reflects what you could rent today.
Choosing the Right Denominator for Shared Housing
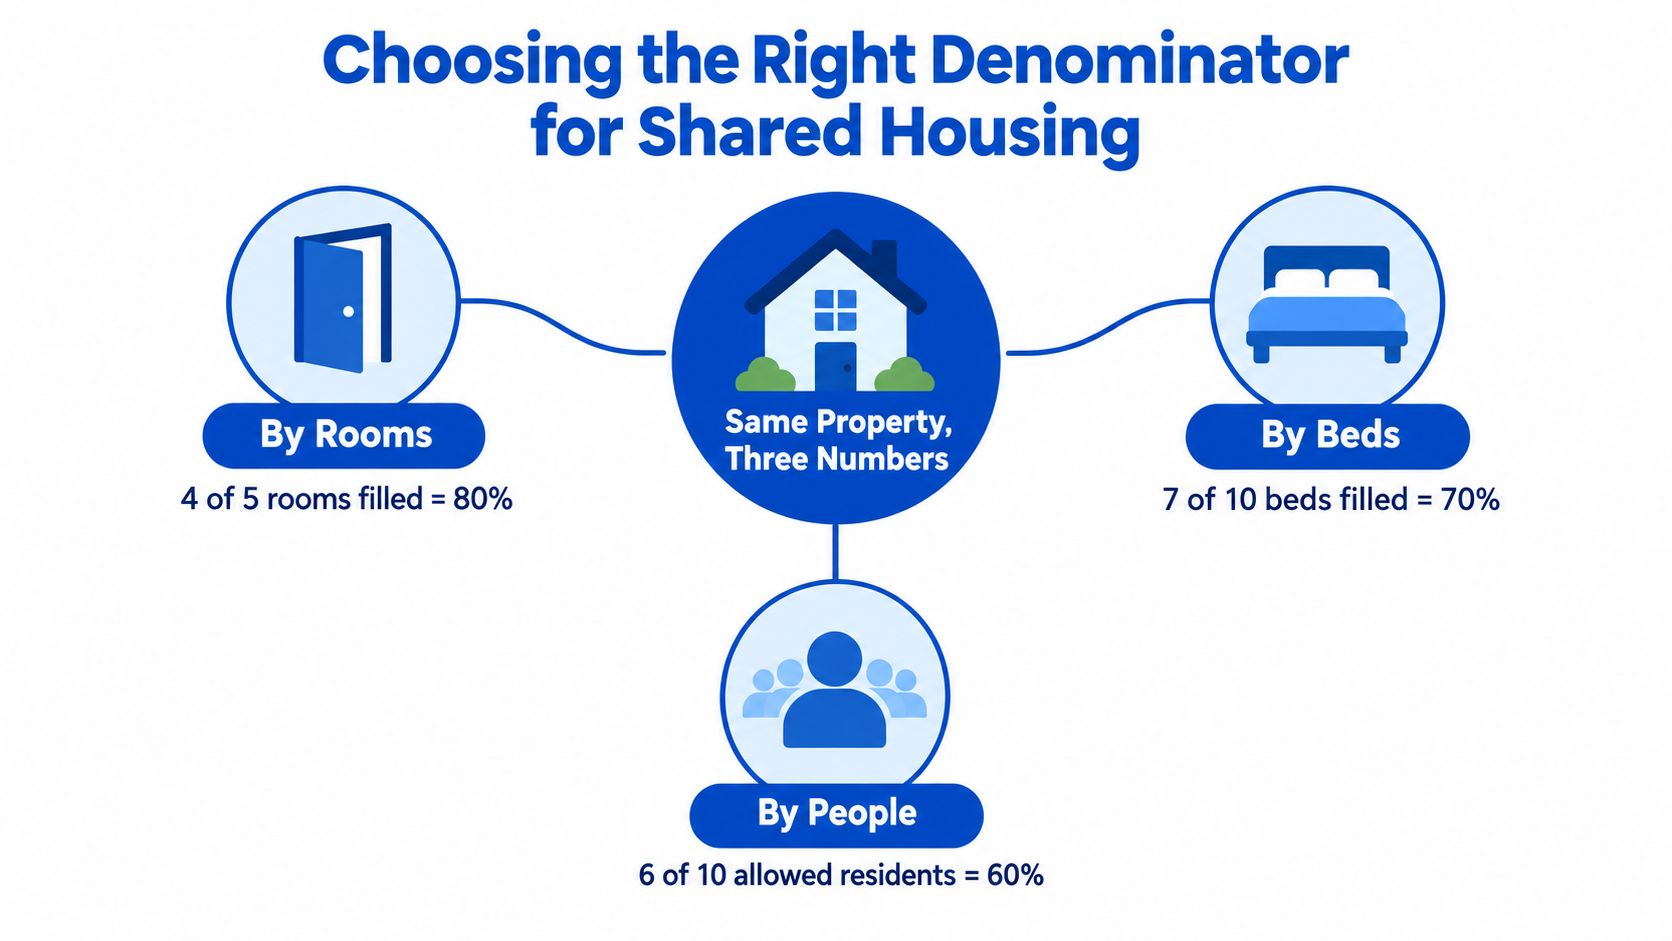
Shared housing can produce three occupancy figures for the same property because hosts may count rooms, beds, or people. None is automatically wrong. Each answers a different operating question.
A five-room house with four rooms occupied has 80% room occupancy. If those rooms contain seven occupied beds out of ten, bed occupancy is 70%. If the property permits ten residents and six people currently live there, tenant occupancy is 60%.
Match the metric to the decision
Room occupancy works best when each bedroom is leased as one income-producing unit. It tells you how many rentable doors are filled.
Bed occupancy matters when rooms contain multiple beds or when your pricing changes by sleeping space. It shows how much sleeping capacity is in use.
Tenant occupancy helps you understand how many approved residents are contributing to the property's resident count. It can reveal a mismatch between physical capacity and the lease structure.
A host might report 90% room occupancy while only monetizing a smaller share of the beds. Another property could have fewer occupied rooms but stronger NOI because its occupied rooms carry better rents and lower operating costs.
Exclude capacity you can't sell
Your denominator should include inventory that is available and marketable now. A bedroom undergoing repairs, held back for an owner, or unavailable because of a serious maintenance issue shouldn't lower your operational occupancy.
Industry guidance recommends excluding rooms that are unsellable because unusable capacity depresses the rate and can lead to poor pricing decisions. It also describes different occupancy ranges by property type, including roughly 68% to 78% for urban full-service hotels, 75% to 85% for extended-stay properties, and 55% to 70% for resorts, as shown in this hotel performance benchmarking guidance.
Common denominator mistakes include:
- Counting out-of-order rooms: A room closed for repairs isn't active inventory.
- Mixing rooms and beds: Occupied beds must be divided by available beds, not bedrooms.
- Including held-back inventory: A room you won't lease today shouldn't be treated as a failed sale.
- Using capacity as demand: The number of allowed residents doesn't prove that residents want every available space.
Track these figures daily or weekly, even if you review the financial result monthly. A monthly average can hide a sharp move-out cluster or a growing queue of inquiries.
For room-by-room leasing fundamentals, see this practical guide to renting by the room.
Occupancy Benchmarks Across Rental and Lodging Sectors
Your occupancy number needs context. A hotel, a multifamily building, a senior housing community, and a pad-style house serve different residents, use different lease structures, and experience different turnover patterns.
The national rental market offers one reference point. In Q2 2026, the U.S. rental vacancy rate was 7.3%, implying rental occupancy of roughly 92.7% nationally. The homeowner vacancy rate was 1.2%, according to the Census Bureau housing vacancy guidance.
That rental figure can help multifamily and single-family operators understand broad housing utilization. It shouldn't become an automatic target for a shared-housing host. A room-by-room property may face more frequent turnover, different resident needs, and a smaller local competitive set.
Occupancy Benchmarks by Sector
| Sector | Typical Occupancy | What It Means for Co-Living |
|---|---|---|
| U.S. hotels | 62.3% in full-year 2025 | Hotels have shorter stays, nightly inventory, and a different pricing model. |
| National rental housing | Roughly 92.7% in Q2 2026 | A broad housing benchmark, not a direct target for every shared house. |
| Senior housing | 89.9% in Q2 2026 | Shows how asset type, resident needs, and demand can support a different occupancy pattern. |
| General hospitality rule of thumb | 60% to 70% is solid | A starting point for context, not a universal pad target. |
| Peak hospitality performance | 80% to 90% is excellent | Strong results can occur during peak periods, but rate and costs still matter. |
The hotel benchmark illustrates the importance of segment context. U.S. hotel occupancy fell to 62.3% in full-year 2025, down 1.2% year over year, while CBRE projected a gradual rise to 62.8% in 2026 and 63.0% in 2027. Those figures sit in a narrow low-60s range, but hotels and shared houses don't sell the same product or measure demand over the same stay pattern. The comparison comes from this hospitality market benchmark.
Senior housing provides another useful contrast. Occupancy reached 89.9% in Q2 2026, with 15 of 31 primary markets at or above 90%, reflecting a sector with its own demand drivers and operating model. The relevant lesson isn't that every pad should reach the same number. It's that good occupancy is segment-specific.
For a fair comparison, build a local peer set with similar room sizes, amenities, resident profile, lease terms, and location. Your closest competitor may be another furnished room operator nearby, not a national hotel average or a large conventional apartment community.
What Drives Occupancy and How It Moves Through the Year
A pad-style rental can show the same overall occupancy in two very different ways. A house with ten rooms may have nine occupied rooms, while another has fewer rooms but more beds filled. Those patterns can produce different rent, turnover, and NOI results, so track room, bed, and tenant occupancy before changing prices.
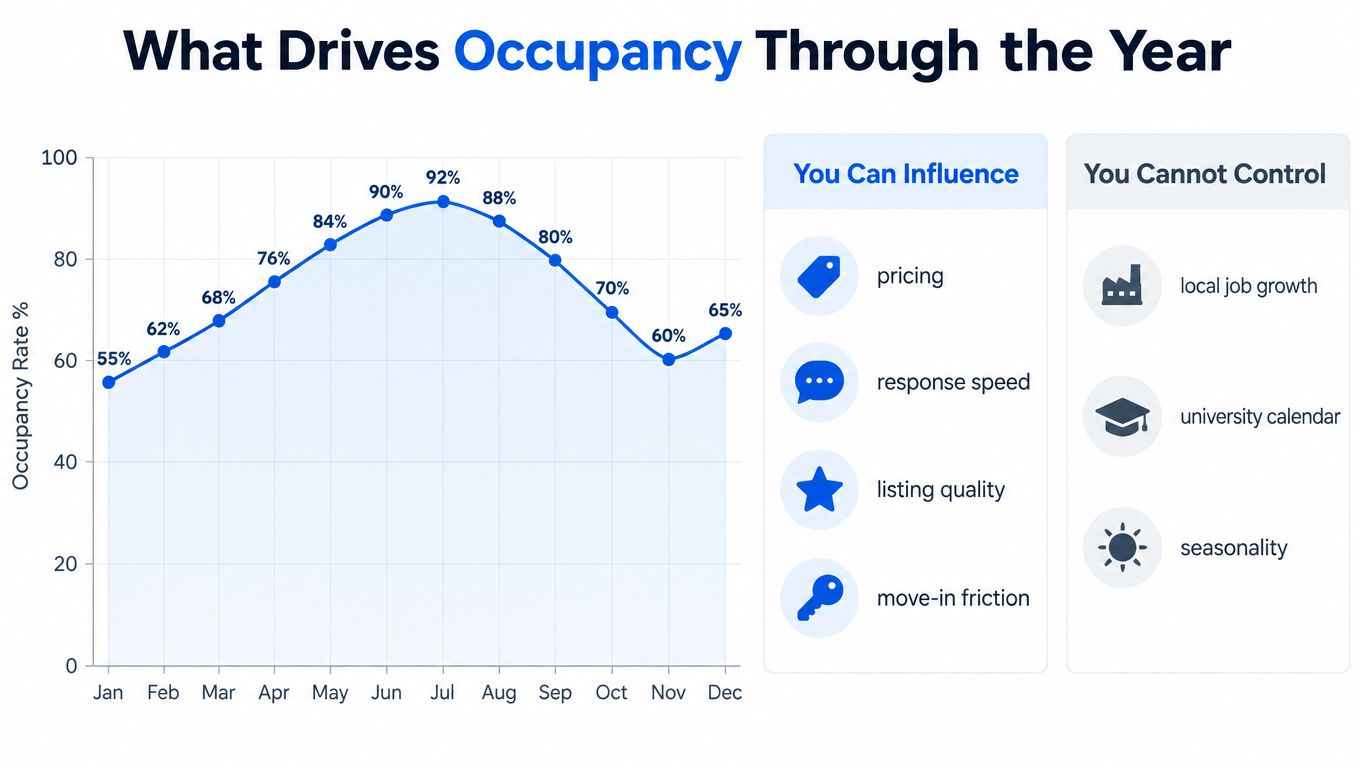
Occupancy depends on two sets of forces. You control the offer, while local demand shapes how many qualified prospects are searching.
Your controllable levers include price, response speed, listing quality, showing availability, screening clarity, and move-in friction. For example, a clean listing and a quick reply can keep a prospect engaged, but they cannot create demand where local hiring has slowed. Job growth, university calendars, seasonal movement, and competing housing supply sit largely outside your control. For a structured way to anticipate those shifts, see our guide to demand forecasting.
A weekly occupancy report works like a thermometer. It shows the property's current condition. A seasonal or trailing view works more like a trend line, helping you decide whether a short dip is normal or whether your listing, pricing, or resident experience needs attention.
Seasonal signals to watch
- Back-to-school demand: Students and education-linked workers may search more actively around the academic calendar.
- Tax-refund season: Some prospects may have more money available for deposits, moving costs, or initial rent.
- Holiday slowdowns: Tours and moves may decline during holidays, making earlier marketing useful.
- Local employment cycles: Hiring, layoffs, and relocations can change demand for affordable rooms.
- Competing supply: New or renovated properties can pull prospects away even when local demand remains steady.
Use these patterns to prepare listings, adjust pricing thoughtfully, and maintain response coverage during likely search periods. A strong monthly rate can still hide repeated short gaps between residents. Weekly reporting exposes those gaps, while seasonal comparisons show whether they recur at the same time each year.
Reading Occupancy Trends Without Getting Fooled
High occupancy doesn't automatically mean a healthy investment. A house can show 90% room occupancy and still underperform if the occupied rooms have lower rents, unusually high utility use, or costs that consume the added income.
The same issue appears across sectors. In Q2 2026, U.S. rental vacancy was 7.3%, unchanged from the prior year, while senior housing occupancy climbed to 89.9%. Hotel occupancy moved differently, falling to 62.3% for full-year 2025, and year-to-date August 2025 occupancy was down 0.8% even as average daily rate grew, showing that higher rates don't guarantee higher occupancy. These cross-sector figures are reported in the Census Bureau housing vacancy data.
Three questions belong beside the percentage
What is occupied? Room occupancy may look strong because the property has many smaller rooms filled, while a larger or higher-rent room remains empty. Bed occupancy may tell a different story if rooms have different capacities.
What is each occupied space worth? Two houses with the same room occupancy can produce different revenue because rents, lease terms, included services, and resident turnover differ.
What does the added occupancy cost? More residents can increase utilities, cleaning, maintenance, supplies, and management time. If those costs rise faster than collected rent, the occupancy gain may not improve NOI.
Decide whether rate or fill matters more
The right decision depends on asset class, local supply, resident segment, and operating costs. If demand is strong and your listing generates qualified inquiries, reducing rent may easily give away revenue. If inquiries have slowed and a room has been vacant long enough to threaten cash flow, a carefully designed price change or concession may produce a better result than holding the old rate.
Use occupancy with rent, collections, turnover, and operating expenses. A useful dashboard might show:
- Occupied rooms and sellable rooms.
- Occupied beds and available beds.
- Average rent by room type.
- Days vacant between residents.
- Inquiry-to-application movement.
- Collected rent and property-level expenses.
- NOI by property and across the portfolio.
Occupancy is often a lagging indicator. By the time the monthly percentage falls, inquiry volume and response conversion may have weakened earlier. Watch those leading signals so you can act before the vacancy appears in the report.
Practical Strategies to Improve Occupancy and Revenue
Improving occupancy starts with removing avoidable friction. A prospect who can't understand the room, get a response, or complete move-in steps quickly may choose another property, even when your price is competitive.
Industry hospitality guidance commonly treats 60% to 70% occupancy as solid and 80% to 90% as excellent, particularly during peak periods, as outlined in this hotel occupancy benchmark guide. For a pad-style operator, use those figures as broad context and judge success against comparable local properties and your NOI.
Adjust pricing with evidence
Review each room's rent, size, furnishings, private or shared features, and recent inquiry activity. A dynamic pricing approach can help you respond to demand without applying one blanket rate to every bedroom.
Why it works: Price is one of the fastest levers you can change, but the goal is not to win the occupancy percentage at any cost. Compare the expected rent with vacancy duration and operating expenses.
Respond before interest goes cold
Create saved replies for common questions about deposits, utilities, house rules, parking, and move-in requirements. Automated follow-up can keep an inquiry from disappearing when you're busy managing another property.
Why it works: Response speed is a leading indicator. A faster, clearer conversation gives a qualified prospect fewer reasons to continue searching.
Make the listing answer practical questions
Show the room, shared areas, storage, parking, transit access, and the path from application to move-in. State what the rent includes and explain house expectations in plain language.
Why it works: Better information filters out poor fits while helping suitable prospects decide with confidence. That can reduce unnecessary back-and-forth and improve showing quality.
Remove move-in friction
Offer clear appointment windows, organized document collection, and reliable access instructions. Keyless smart-lock access can reduce coordination problems when a resident is approved and ready to enter.
Why it works: A simple move-in process reduces delays between approval and occupancy. It also gives hosts a consistent process across multiple rooms.
Protect margins in occupied rooms
Track utility-heavy patterns and use smart thermostat controls where appropriate. Set reasonable comfort rules and monitor unusual consumption instead of treating every occupied room as equally profitable.
Why it works: Occupancy only helps NOI when the income from the resident exceeds the incremental costs of serving that space.
Review portfolio-level performance
Compare rooms by property, type, rent, vacancy duration, and resident turnover. Add comparable-rent and local-demand information before changing pricing, rather than relying on a single full-house average.
Why it works: Portfolio visibility shows whether one property is masking another property's weakness. It also helps you identify which room types deserve better marketing or a different price.
An all-in-one management platform such as PadPulse is designed to centralize pricing, resident communications, access control, reporting, portfolio analytics, and market intelligence for co-living operators. The practical goal is simple: measure the right occupancy rate, connect it to revenue and costs, and make the next decision from evidence rather than instinct.
Start with one property this week. Record sellable rooms, occupied rooms, occupied beds, collected rent, and vacancy days, then compare those figures with the same period in your next review. Small measurement improvements can give you a much clearer path to stronger occupancy and healthier NOI.
PadPulse brings dynamic pricing, AI-powered messaging, smart-lock and thermostat integrations, P&L tracking, portfolio analytics, and comparable-rent intelligence into one toolkit for pad-style operators. Visit PadPulse to join the interest list and learn about early access as the platform moves toward launch.