Gross Potential Rent Explained: A Practical Guide for Hosts
September 11, 2026
You're sitting at the kitchen table with last month's deposits on one side and the rent amounts from your listing photos on the other. The property has five rentable rooms, yet the cash collected feels disconnected from what the house appears capable of producing. The missing piece is often gross potential rent, or GPR.
GPR answers a simple question: What could this property generate if every rentable room were occupied for the full period at current market rent, with no vacancy, concessions, or collection loss? It's a planning benchmark, not a deposit amount. Once you calculate it room by room, you can see exactly how much income your property could produce, how much it produces, and where the gap comes from.
What Gross Potential Rent Actually Means
Gross potential rent is the theoretical maximum rental income for a property under ideal conditions. In commercial real estate underwriting, that means full occupancy, zero vacancy, zero concessions, zero downtime, and full collection at market rent. Wall Street Prep defines GPR as the maximum rent before vacancy and other deductions.
For a pad-style property, the calculation starts with every rentable room, not just the building as a whole. If your house has five rooms, you estimate what each room could command today, assume each is available for the full period, and add the room values together. The result gives you the property's income ceiling before real operating conditions reduce it.
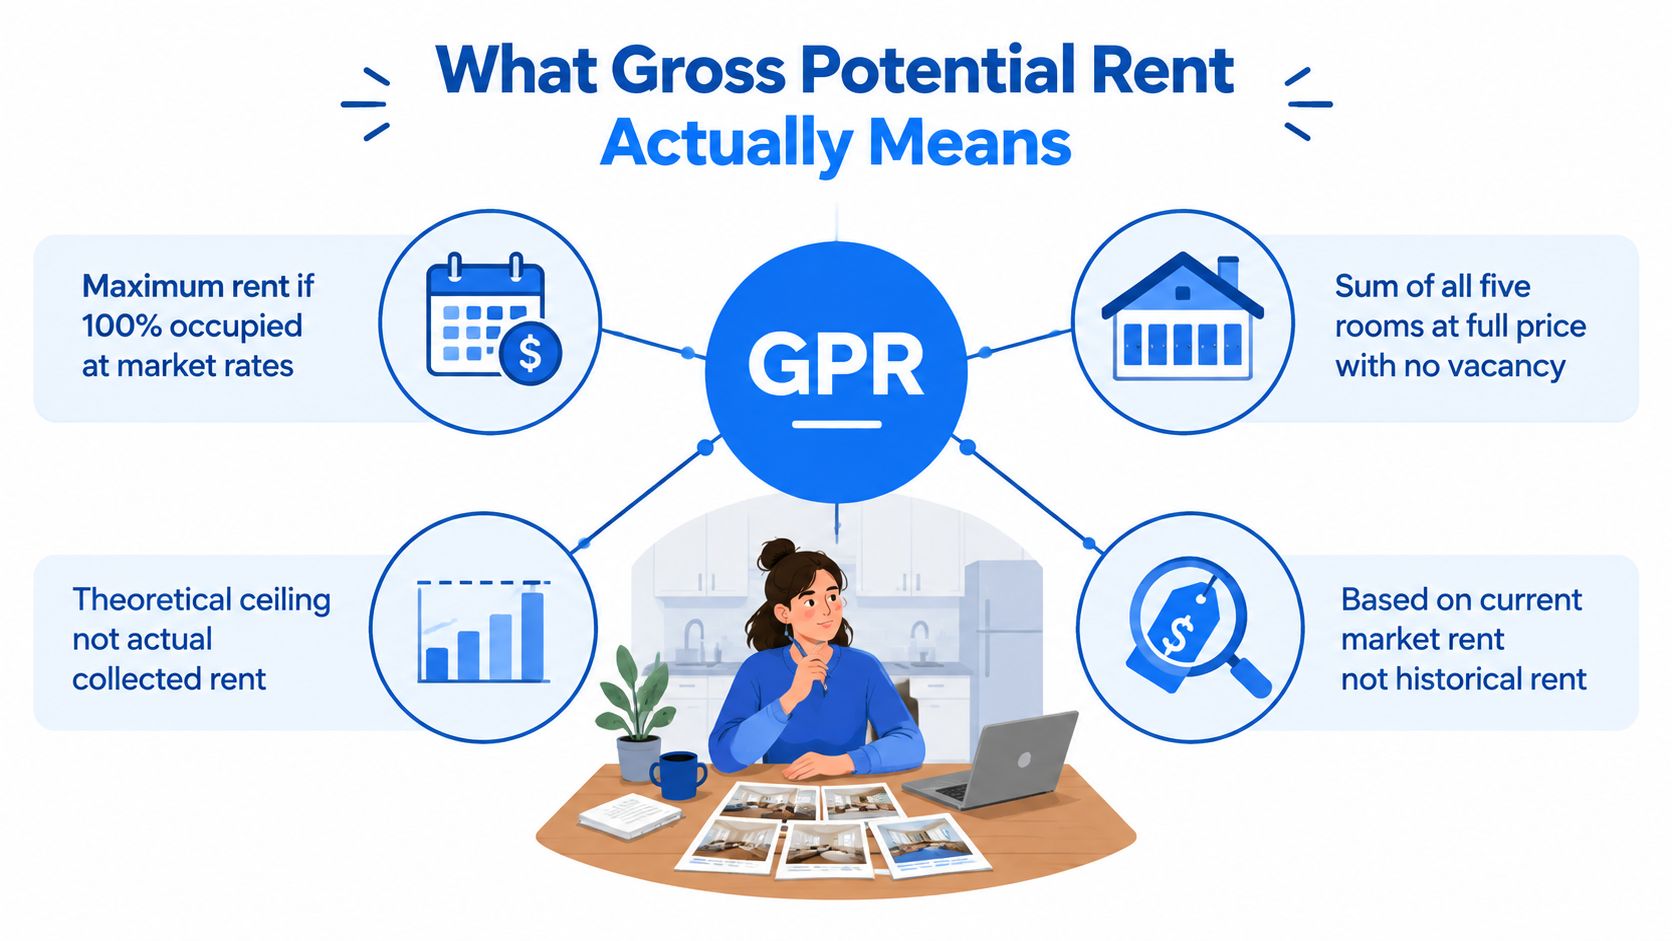
GPR is a benchmark, not collected rent
A room can have a market rent of $1,100 on your rent roll and still produce less than that during a month with a vacant bed, a move-in discount, or an unpaid balance. GPR keeps the comparison honest by showing what the property could have produced before those deductions.
Three common forces pull collected revenue below GPR:
- Vacancy: A room produces no rent while it sits empty.
- Concessions: Discounts and move-in incentives reduce the amount collected against the advertised rate.
- Turnover: Cleaning, repairs, and leasing gaps can leave a room unavailable between residents.
That's why GPR is useful even when it never appears in your bank account. It gives you a consistent ceiling for pricing, budgeting, and performance review. Industry guidance describes vacancy loss as a deduction from GPR before reaching effective gross income.
Practical rule: Treat GPR as the answer to “What could this property earn?” Treat collected rent as the answer to “What did this property earn?”
The GPR Formula Broken Down Step by Step
The standard formula is straightforward:
Annual GPR = total rentable rooms × market rent per room × 12
For a room-by-room operation, a more accurate version is:
Annual GPR = (Room 1 market rent × 12) + (Room 2 market rent × 12) + each additional room's annual contribution
The number 12 represents the months in a year, as shown in this overview of the gross potential rent formula. For a monthly GPR figure, you leave the annualization factor out.
Define each input before doing the math
Rentable rooms means the rooms you're allowed and prepared to lease. Don't include storage areas, shared living rooms, or spaces that can't legally function as bedrooms.
Market rent means the amount a room could command today if you listed it fresh in the local pad-style market. It isn't automatically the current resident's rate, and it shouldn't reflect an optimistic number chosen only because it makes the forecast look better.
Room characteristics matter. A master bedroom with an ensuite may command more than a small room near the kitchen. Furnishing, floor level, natural light, closet space, parking access, and room size can all affect achievable rent. Using one average rent for every room is faster, but it hides differences that can distort your ceiling.
| Variable | Definition | Example Value |
|---|---|---|
| Rentable rooms | Rooms available for lease | 5 rooms |
| Market rent per room | Current achievable rent for each room | $950 to $1,400 |
| Monthly GPR | Sum of all room market rents | Room-level total |
| Annualization period | Months used to express annual rent | 12 months |
| Annual GPR | Monthly room total multiplied by the annualization period | Monthly GPR × 12 |
Time availability also matters. A room available from January through December contributes a full year of potential rent. A room that becomes available partway through a month contributes only for the period when it could have been leased. For a practical forecast, list each room, assign its current market rent, identify its available window, multiply those inputs, and sum the results.
A Room by Room GPR Example for a Five Room Property
Let's work through a five-room pad-style property. Each room has a different position in the house, so each receives its own market rent rather than sharing one average assumption.
| Room | Baseline Monthly Rent | Summer Adjusted Rent | Annual Contribution |
|---|---|---|---|
| Room 1, master with ensuite | $1,400 | $1,540 | $18,480 |
| Room 2, standard | $1,100 | $1,100 | $13,200 |
| Room 3, corner | $1,200 | $1,320 | $15,480 |
| Room 4, small | $950 | $950 | $11,400 |
| Room 5, furnished | $1,250 | $1,375 | $14,490 |
At baseline pricing, the monthly calculation is:
$1,400 + $1,100 + $1,200 + $950 + $1,250 = $5,900
So the property's flat annual GPR is:
$5,900 × 12 = $70,800
That figure assumes every room earns its baseline market rent throughout the year.
Add a seasonal pricing layer
Now assume rooms 1, 3, and 5 command 10% more during three summer months, while the other nine months remain at baseline. The adjusted monthly rents for those rooms become:
- Room 1: $1,400 × 1.10 = $1,540
- Room 3: $1,200 × 1.10 = $1,320
- Room 5: $1,250 × 1.10 = $1,375
The summer premium adds $385 per month across those three rooms. Over three months, that contributes $1,155 above the flat baseline, producing a blended annual GPR of $71,955.
The process is repeatable:
- List every room. Give each one its own market rent.
- Separate baseline and seasonal periods. Use the rate that reflects the room's current demand.
- Multiply each rate by its availability period.
- Add every room's contribution.
This approach gives you a more realistic ceiling than multiplying an assumed average by the number of rooms. It also makes later adjustments easier. If Room 4 needs a price change, you can update one line without rebuilding the whole property forecast.
GPR vs Effective Rent, Vacancy Loss, and Gross Scheduled Rent
These terms often appear beside one another, but they answer different questions. GPR measures the ideal rent ceiling. Gross scheduled rent, or GSR, also assumes every room is occupied at the scheduled market rate for the full period, so it functions as the scheduled before-loss amount in a basic rent roll.
Effective rent moves closer to realized performance. It subtracts vacancy and credit loss from GPR, while concessions and other collection leakage may also reduce what the operator ultimately receives. Economic vacancy is commonly expressed as lost rent divided by GPR.
| Metric | What It Measures | Includes Vacancy? | Sample Value |
|---|---|---|---|
| GPR | Maximum rent at full occupancy and market pricing | No | $12,750 |
| GSR | Scheduled rent before vacancy deductions | No | $12,750 |
| Effective rent | Rent remaining after vacancy and credit loss | Yes | $10,170 |
| Vacancy loss | Dollar gap caused by vacancy, concessions, and bad debt | Reflected as a loss | $2,580 |
Consider a five-room property with $12,750 of GPR. Two rooms sit vacant for part of the month, and the operator grants a $150 concession. The combined vacancy and concession impact produces a $2,580 vacancy loss, leaving $10,170 of effective rent.
The arithmetic is:
$12,750 GPR − $2,580 vacancy loss = $10,170 effective rent
The value of this breakdown is diagnostic. GPR tells you whether your pricing target is credible. Vacancy loss tells you how much potential disappeared. Effective rent tells you what remained after the leakage.
Use each metric for its proper decision
- GPR supports pricing strategy. It shows the revenue ceiling if the room mix performs at target rates.
- GSR supports stabilized underwriting. It presents scheduled rent before operating losses.
- Effective rent measures realized performance. It connects the forecast to collections.
- Vacancy loss identifies the gap. It helps separate empty rooms from concessions and uncollected balances.
For a deeper explanation of how rental revenue flows into income reporting, see gross effective income and its role in property analysis. Keeping the labels separate prevents a common mistake: comparing collected cash directly with GPR without explaining why the figures differ.
Why GPR Matters for Forecasting and NOI
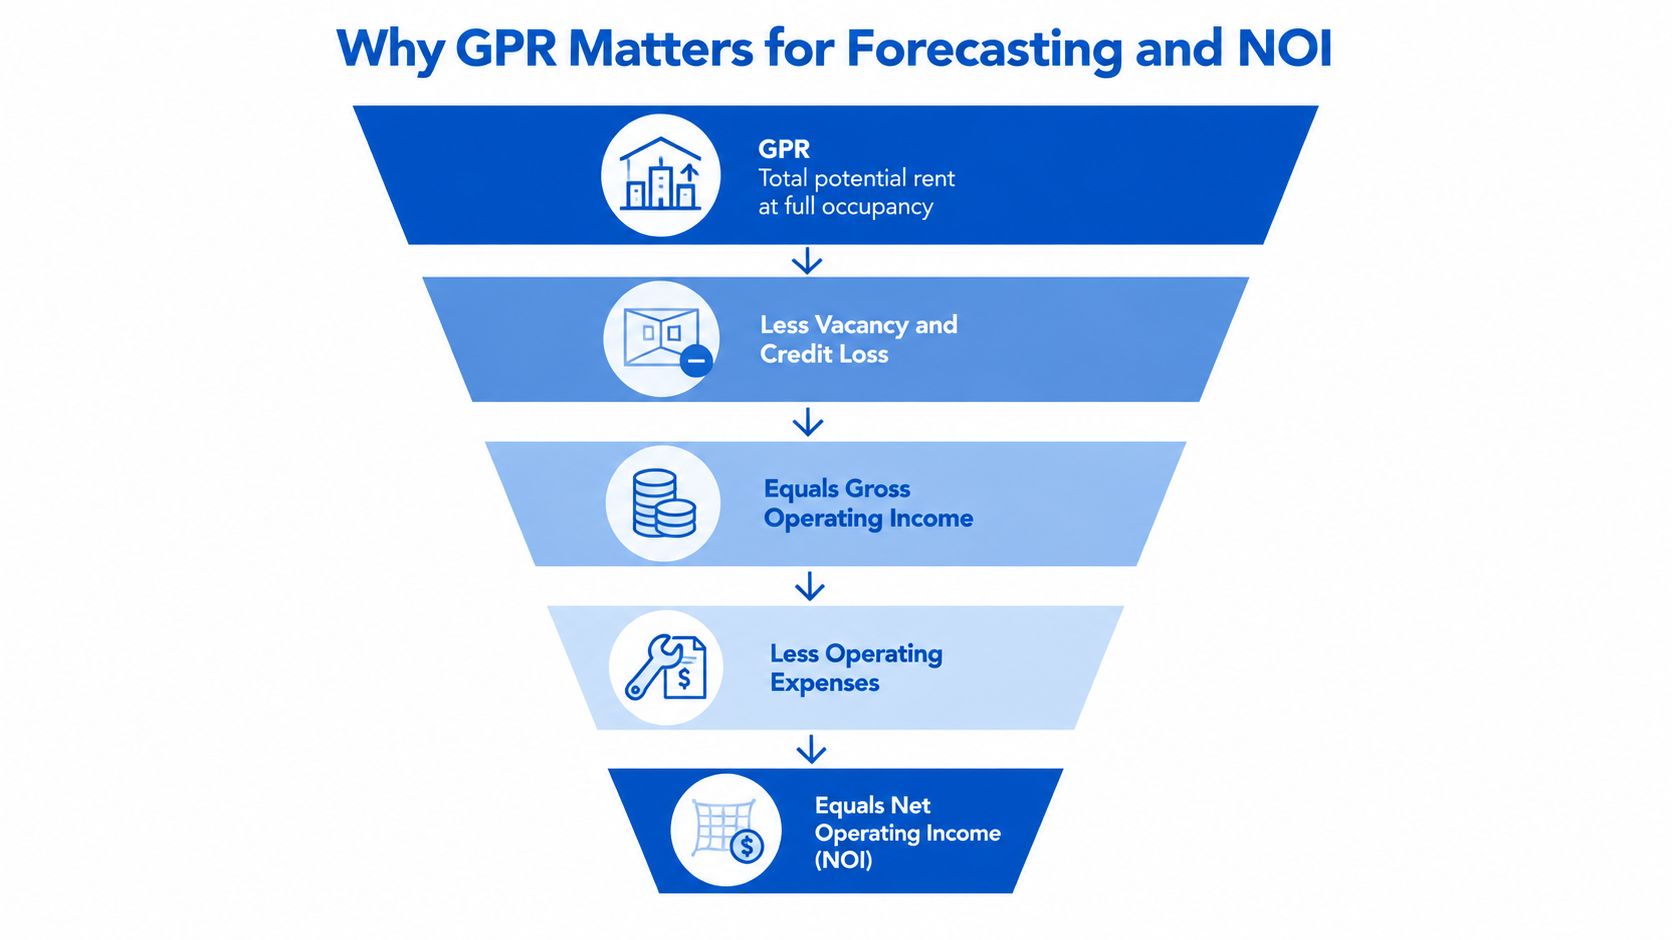
GPR sits at the top of the revenue waterfall. Start with the full potential rent, subtract vacancy and credit loss, arrive at gross operating income, then subtract operating expenses to reach net operating income, or NOI.
GPR − vacancy and credit loss = gross operating income
Gross operating income − operating expenses = NOI
A useful illustration comes from a five-room house with $244,800 of annualized GPR. A 5% occupancy swing changes potential collected rent by roughly $12,240 before expenses, as shown by the relationship between GPR and vacancy loss in this GPR reference. By comparison, a $25 rent increase across five rooms raises annual GPR by only $1,500, assuming the increase applies throughout the year.
That comparison explains why operators shouldn't focus only on headline rent. A higher asking price can't help if it creates longer vacancy. Filling rooms and reducing downtime can convert more of the existing ceiling into collected revenue.
GPR gives different properties a common language
A five-room house and a larger portfolio may have very different room counts, rents, and seasonal patterns. GPR gives you a uniform starting point for comparing them. You can review each property's potential, then examine how much of that potential becomes realized rent after vacancy, concessions, and collection loss.
Investors and lenders also examine stabilized GPR assumptions when they evaluate acquisitions or refinancing. They want to know whether the market rents behind the forecast are achievable and whether the operator has modeled the deductions realistically. Fannie Mae's multifamily guide, for example, requires at least a 5% economic vacancy assumption before loan sizing, according to the discussion in this recent GPR glossary.
For a practical walkthrough of the full income calculation, use this guide to calculating net operating income.
Common GPR Pitfalls and Real World Adjustments
A healthy GPR number can still hide weak operations. The problem usually starts when an operator treats the ceiling as fixed even though room demand, concessions, and turnover conditions keep changing.
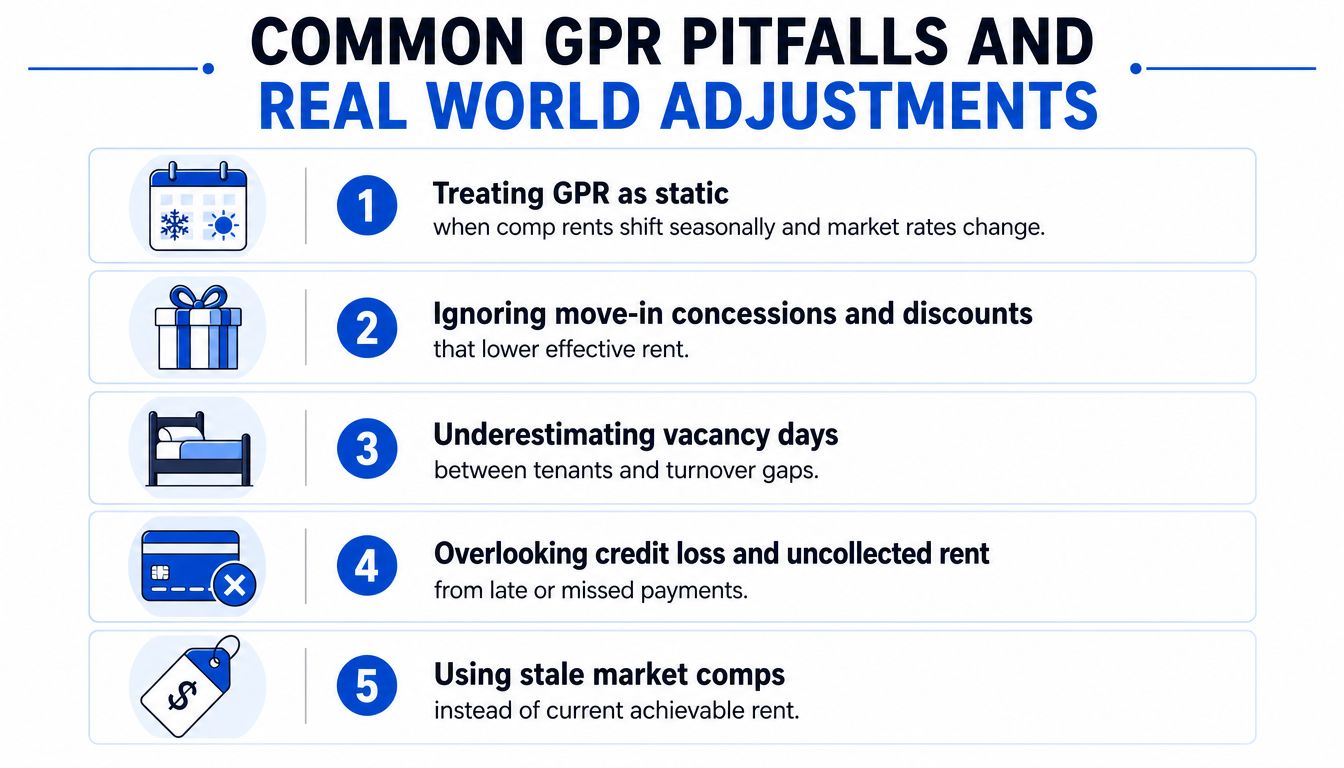
Five adjustments that keep the forecast grounded
Seasonal comp shifts. A rent that was achievable during a strong demand period may not remain achievable later. Refresh comparable listings regularly and separate seasonal assumptions instead of carrying one static rate through every month.
Move-in concessions. A room listed at a headline rate may collect less after a discount or incentive. Record the concession separately and spread its impact across the lease term when reviewing effective performance.
Turnover downtime. A room isn't revenue-producing while it's being cleaned, repaired, or prepared for the next resident. Build a turnover reserve into the availability schedule rather than assuming the next lease begins immediately.
Premium-room overpricing. A master room or furnished room may justify a premium, but the listed amount still needs market support. Review premium pricing monthly and compare inquiry quality, showing activity, and signed leases.
Mixed revenue categories. Common-area fees, parking, utilities, and amenity charges don't automatically belong in room rent. Keep those categories separate so you don't count the same revenue in both GPR and other income.
The corrective habit is simple: use current achievable rent, expose concessions, and show every period when a room couldn't produce rent. A GPR primer also distinguishes the ideal rent ceiling from economic vacancy and other income treatment.
Before you lock in a GPR number, ask three questions: Is the rent market-tested? Are concessions visible? Is turnover downtime included?
Tracking GPR With PadPulse and Turning It Into Action
GPR becomes useful when you update it as operating conditions change. A rent roll that shows last season's rates may still calculate correctly, but it won't represent the current ceiling for a room that has become easier or harder to lease.
A practical workflow starts with room-level market rent. Dynamic pricing can compare current listings, seasonality, and demand signals, then refresh the target rate for each room. The operator can review the proposed rate rather than relying on one property-wide average.
Next, P&L tracking connects the ceiling to actual collections. Each room can show its potential rent, collected rent, vacancy days, concessions, and remaining gap. That turns a broad question, “Why was revenue low?” into a specific one, such as “Did Room 3 lose income through downtime or through pricing?”
| PadPulse Feature | GPR Use Case | What It Updates |
|---|---|---|
| Dynamic pricing | Refresh room-level market rent | The GPR ceiling for each room |
| P&L tracking | Compare potential with collected income | Vacancy, concessions, and collection gaps |
| Portfolio analytics | Compare multiple pads consistently | Property-level GPR and realized revenue |
| Market intelligence | Review comparable rents and demand | Pricing assumptions behind the forecast |
The portfolio view matters because one property may be close to its ceiling while another leaves a large gap. Aggregating GPR against realized revenue helps you identify whether the issue is pricing, vacancy, turnover, or collections. You can then direct attention to the rooms with the clearest operational opportunity.
For operators who want a closer look at room-level financial visibility, P&L tracking for rental operations provides the right framework. The goal isn't to admire a large GPR figure. It's to open the dashboard, see the ceiling, see what arrived, and know what action could close the difference.
Bringing It All Together With a Simple Monthly Routine
You don't need a complicated process to keep GPR useful. A short review on the first Monday of each month can keep your forecast connected to what happened in the house.
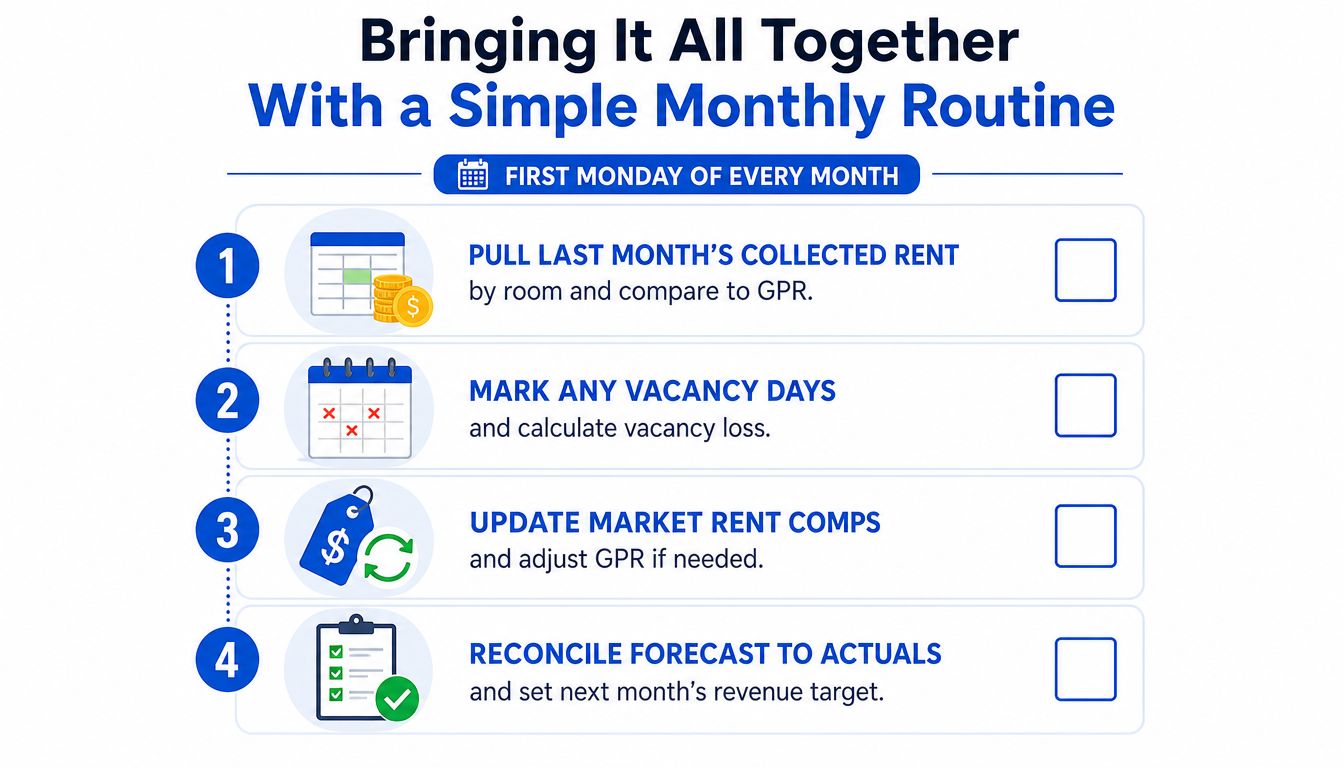
- Pull collected rent by room. Compare each room's actual deposits with its current GPR contribution.
- Mark vacancy and concessions. Record empty days, move-in discounts, and unpaid balances separately.
- Refresh market rent. Check comparable rooms and update the GPR calculation wherever achievable pricing changed.
- Reconcile the forecast. Log the gap between GPR and realized revenue, then set the next month's target.
Give yourself five minutes to identify which rooms underperformed. Spend another fifteen minutes reviewing pricing for any room where occupancy slipped or inquiries weakened. This keeps the review focused on decisions rather than paperwork.
Finally, compare this month's GPR-to-realized ratio with the trailing three months. You're looking for drift. If the gap widens, investigate the cause before it becomes a habit. If it narrows, document what changed so you can apply the same operating behavior elsewhere.
Gross potential rent is most valuable when it stays current. Recalculate it room by room, explain every deduction, and use the result as a living target rather than a once-a-year underwriting figure.
PadPulse brings room-level dynamic pricing, P&L tracking, market intelligence, and portfolio analytics into one workflow for co-living operators. Visit PadPulse to join the interest list and get updates about early access as the platform moves toward launch.