Demand Forecasting for Room-by-Room Rentals
August 9, 2026
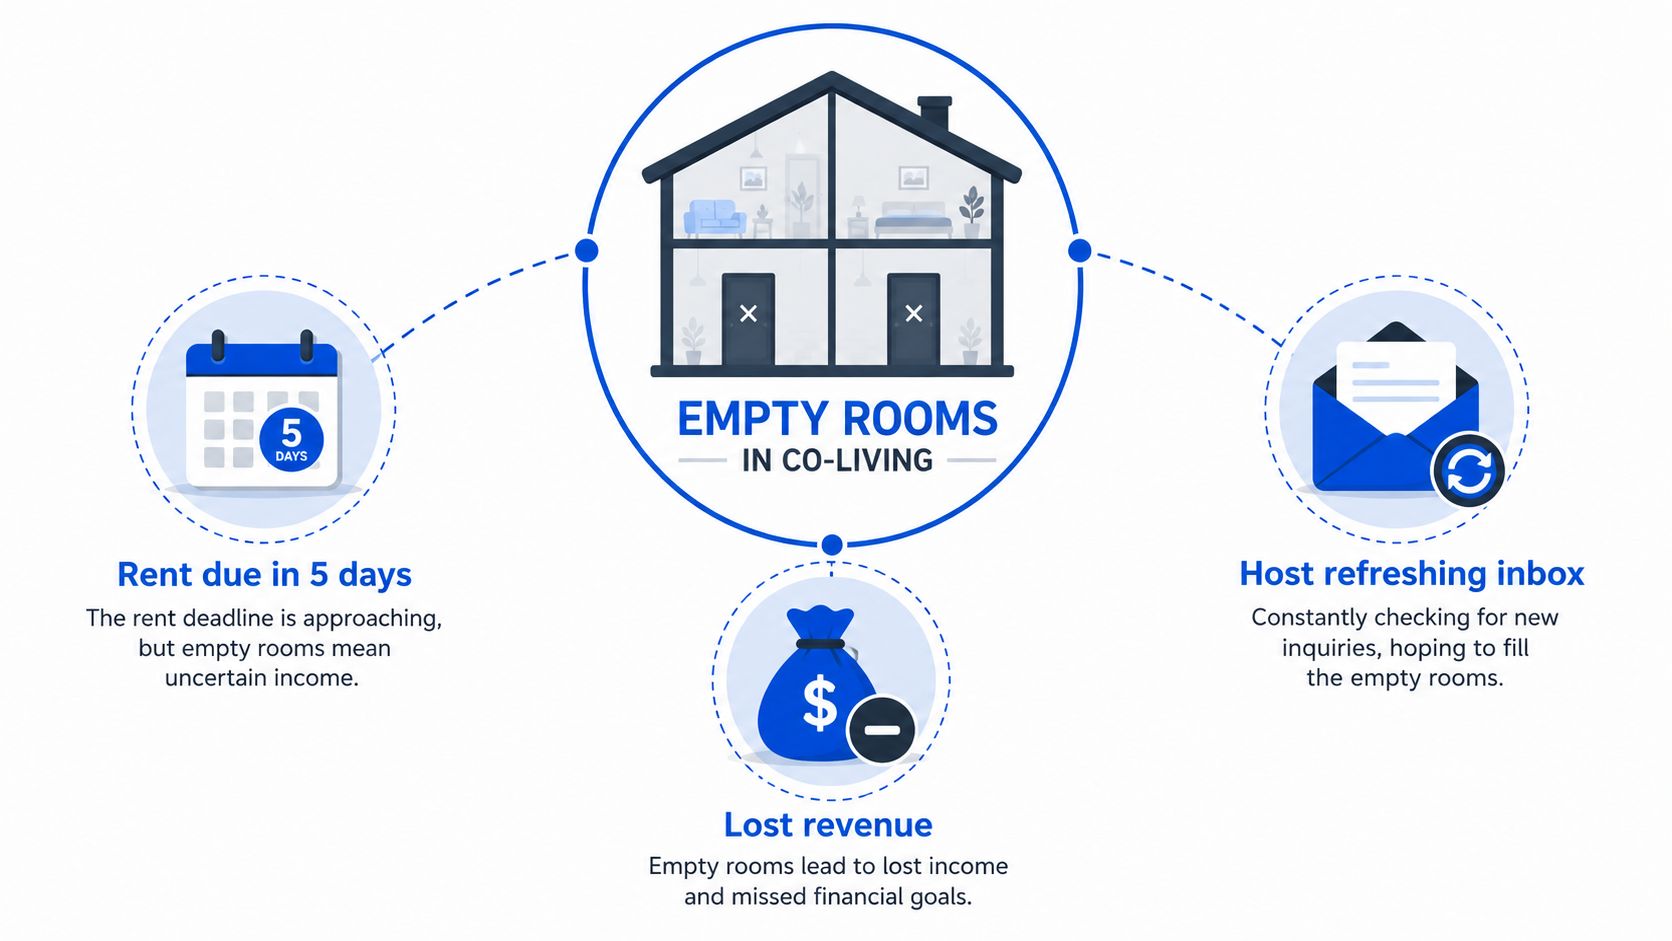
You've got a six-bedroom house and two rooms sitting empty. Rent is due Friday, the inbox is quiet, and every hour you wait feels like money leaking out of the property. That's the moment demand forecasting stops sounding like a corporate planning term and starts looking like a survival skill for a room-by-room host.
For a first-time PadSplit host, the hard part isn't understanding that vacancies hurt. It's figuring out which room will fill next, when it will fill, and what you should do before the gap gets wider. A good forecast turns guesswork into a repeatable process, so you're not making pricing and messaging decisions based on stress alone.
Why Empty Rooms Are the Real Forecasting Problem
A six-bedroom house with two empty rooms doesn't just have a vacancy issue. It has a timing problem, a pricing problem, and a messaging problem all at once. If one room sits open for another two weeks, you're not just losing rent, you're losing momentum, because fresh leads stop matching the room's exact move-in window.
What you're actually trying to predict
In room-by-room rentals, demand forecasting means estimating future inquiry volume, showings, applications, and move-ins for a specific room or house. That's different from reporting last month's occupancy. Occupancy tells you what happened, while forecasting tells you what's likely to happen next, which is the view that drives pricing and marketing choices.
A house is basically a small portfolio of separate products. Room 1 may get strong interest from remote workers, while Room 5 might only convert when commute timing and price line up. If you treat the whole house like one unit, you miss the fact that each room has its own demand curve.
The same logic applies to constrained inventory. A room that was off-market for repairs, or held back for a late-paying member, can make your history look weaker than it really was. A model trained on that kind of data learns supply-side problems as if they were weak demand, which is why unconstrained demand matters more than the raw sales log.
Practical rule: don't ask, “How full was the house?” Ask, “How much demand did each room generate, and what got in the way of closing it?”
For operators who want a local signal instead of generic market chatter, local market intelligence helps you separate a true demand dip from a temporary noise spike. That matters in small portfolios because one empty room can distort your read on the entire house.
The simple mental model
Think of forecasting as answering two questions before Friday arrives.
- What should I expect? Leads, showings, and likely move-ins.
- What should I do? Hold price, lower price, or push harder on outreach.
That's the discipline. It replaces “I hope somebody bites” with a structured decision about the next move. In a six-room house, that's the difference between reacting late and acting while the room still has time to fill.
How Forecasting Lifts Occupancy and NOI
A forecast changes daily decisions. It shows you when to protect average daily rate, when to push for faster fills, and when an empty room is about to start dragging on net operating income. For a first-time PadSplit host, that means you can act before a vacancy gets old instead of waiting until the room has already lost momentum.
What you're trying to predict
For a six-bedroom house, the question is simple on the surface and messy underneath. Which room is likely to fill next, how long will it take, and what should you change before the gap grows?
One room may pull strong interest from remote workers, while another only converts when commute timing and price line up. If you forecast at the house level, those differences blur together. If you forecast at the room level, you can see where demand is strong, where it is weak, and where a small pricing move could make the difference.
The same idea applies to rooms that were unavailable for a while. A room held back for repairs, or kept off-market for a late-paying member, can make your history look softer than it really was. A model that reads those gaps as weak demand learns the wrong lesson, so the more useful question is how much demand each room created once it was available to rent.
Practical rule: don't ask, “How full was the house?” Ask, “How much demand did each room generate, and what got in the way of closing it?”
If you want a local signal instead of broad market chatter, local market intelligence helps you separate a real demand dip from a temporary noise spike. That matters in small portfolios because one empty room can distort your view of the entire house.
A simple room-level example
Say your six-bedroom house is sitting at 83% occupancy. In plain terms, that usually means one room is empty most of the time, and another room may be turning over soon. Better forecasting helps you see that coming early, so you can keep the room from sitting idle longer than it should.
The business logic is straightforward.
- Higher occupancy means more nights filled.
- Better room pricing protects revenue when demand is strong.
- Fewer long vacancies improves NOI because fixed costs are spread across more occupied rooms.
Even a basic spreadsheet can show the pattern. If a forecast helps you fill one room sooner, occupancy improves and the revenue tied to that room starts sooner. If it also helps you avoid discounting during a strong week, you protect ADR at the same time.
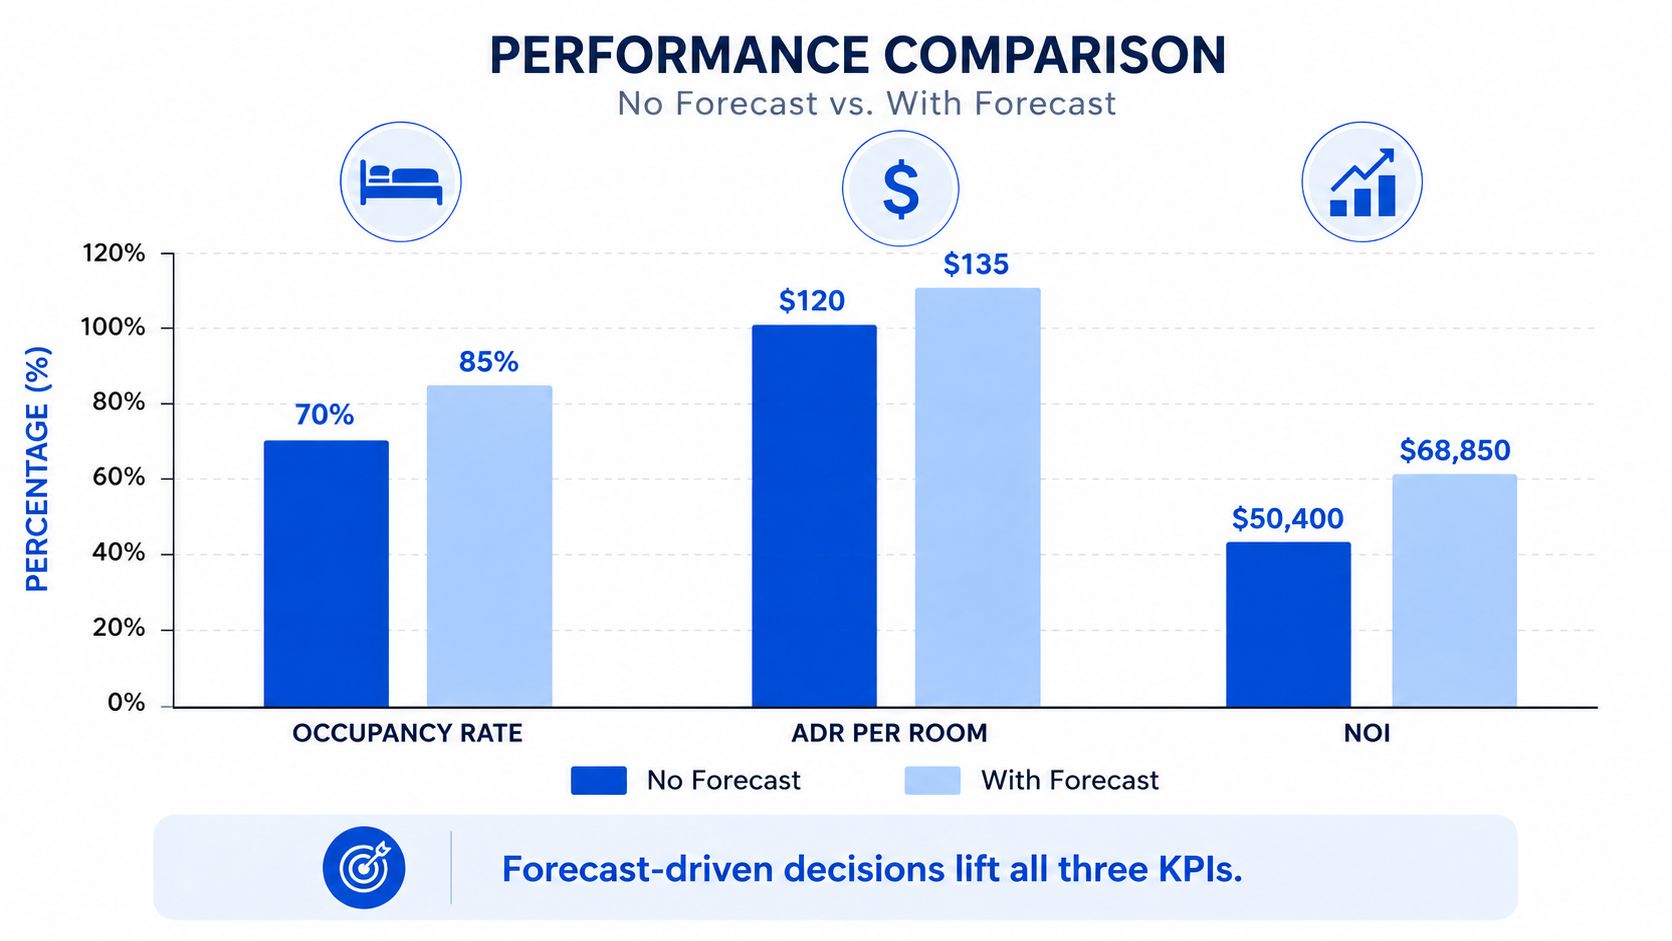
Forecasting also keeps you from treating revenue like one flat number. A single empty room can cost more than a small pricing mistake if it stays vacant long enough. That is why hosts who track forecasted demand alongside occupancy and room-level pricing usually make calmer decisions, especially when a lease turn lands right before a slow week.
Why the lift compounds
The benefit does not come from one lucky month. It comes from repeating the process, checking what happened, and updating the forecast each cycle. Over time, the house's own history becomes more useful, because you are not just recording results. You are learning which signals matter for your rooms.
A forecast only matters if it changes a decision before the vacancy ages.
That is the NOI link. Forecasting helps you decide what to do today so next month does not start with two empty rooms and no plan.
Choosing the Right Forecasting Method for Your Portfolio
A six-bedroom house does not need the same forecasting setup as a fifty-unit portfolio. If you are managing a single house with a handful of room turns, start with a simple method that helps you see occupancy risk early. If you have more homes, steadier inquiry flow, and enough history to compare one month to the next, you can add more structure without making the forecast harder to use.
A practical comparison for room-by-room rentals
| Method | Data Needed | Best For | Watch Out For |
|---|---|---|---|
| Naive baseline | Past occupancy, lead volume, simple seasonality | A first pass for a small house | It can miss pricing shifts and unusual local events |
| Time-series models | A longer history of inquiry, move-in, and vacancy patterns | Recurring seasonality and stable demand | They learn the past too literally if the market changes |
| Causal or regression models | Prices, promotions, local events, comp rents, lease timing | Hosts who can connect market drivers to room demand | Dirty inputs can make the model look smarter than it is |
| Machine learning | Clean, high-volume inquiry and lease data | Larger portfolios with many observations | It is easy to overreach with too little data |
A simple rule helps here. If you have one full seasonal cycle of room data, and more is even better, you can begin with a baseline that respects seasonality. Historical patterns matter most when they match the rhythm of your house, such as slow winter leads, stronger summer move-ins, or a rush after local school calendars shift. IBM's demand forecasting guidance also frames forecasting as a process of defining the goal, collecting the right data, testing methods, and checking accuracy over time.
Perfect data is not the prerequisite. The right data is. For a PadSplit-style house, that usually means room-level occupancy history, inquiry flow, move-in timing, and the price points that helped a room rent faster or sit longer.
For room-by-room operators, the practical path stays simple. Start with a baseline, add market drivers once you can track them cleanly, and move into machine learning only when the data is steady enough to trust. A six-room house rarely needs a complex model on day one, because the goal is not to impress anyone with model design. The goal is to decide whether to hold price, adjust it, or wait one more week before a room ages into a bigger vacancy problem.
Rule of thumb: if you cannot explain why the forecast changed, the model is moving faster than the operation can handle.
A useful check is to tie every method back to the numbers that affect NOI. If the forecast says occupancy will rise, what happens to ADR if you keep price flat? If it points to softer demand, how much revenue do you lose by waiting another week to fill the room? Those are operator questions, and they are the right ones for a first-time host managing a house room by room.
The portfolio performance tracking guide is a useful companion if you are setting up your first house-level dashboard, because forecasting works better when the records behind each vacant room are clear and easy to review.
The Data and Features That Actually Move the Forecast
The best forecasts for a small co-living portfolio usually come from the data you already touch every week. You don't need a giant dataset. You need the right columns, kept clean, with the story behind each vacancy written down.
The core inputs to capture
A useful forecast sheet for a six-bedroom house should include:
- Inquiry counts by day or week
- Lead-to-lease conversion rate
- Lease start and end dates
- Room-level pricing history
- Local market comps
- Source of each inquiry
- Reason a room stayed empty
- Seasonality markers
- Nearby employer or school dates
- Competitor rent changes
These are the inputs that usually matter most for a small house. Seasonality, day-of-week inquiry patterns, and local rent comparisons tend to move the needle faster than broad macro indicators. If a room gets three inquiries from the same neighborhood after a rent cut nearby, that's far more useful than a generic economic headline.
A clean tracking habit matters as much as the model itself. If you never record why a room sat empty, you lose a feature. If you don't tag where each inquiry came from, you can't tell whether one marketing channel is outperforming another.
The portfolio performance tracking guide is a useful companion if you're setting up your first house-level dashboard, because forecasting gets easier when the same data also shows how the property performed after the fact.
What matters most for a small house
For a six-bedroom property, a few signals often outweigh everything else.
| Signal | Why it matters |
|---|---|
| Seasonality | Move-ins and inquiries often rise and fall with the calendar |
| Day-of-week inquiry flow | Some rooms get more attention after paydays or weekends |
| Local comp rents | Nearby pricing shapes how quickly people respond |
| Lease timing | Gaps between move-out and move-in create avoidable vacancy |
| Inquiry source | Not every lead channel converts the same way |
The bigger the portfolio gets, the more external data starts to matter. In a small house, though, simple and reliable usually beats fancy and incomplete. Clean inputs beat clever assumptions every time.
A Practical Step-by-Step Implementation Plan
A first forecast doesn't need to be perfect. It needs to be usable. If you've got six rooms and messy data, the goal is to turn that mess into a weekly number you trust enough to act on.
Weeks 1 and 2, clean and label the history
Start with every lead, lease, and vacancy you can find. Put them into one sheet and label each row with the room, date, source, price, and outcome. If a room was offline for repairs or held for a renewing member, mark that too so you don't train the forecast on distorted data.
Your deliverable here is a cleaned worksheet, not a model.
Practical rule: if you can't explain a vacancy in one sentence, you probably can't forecast it accurately yet.
Weeks 3 and 4, build a baseline
Use a simple moving average or a seasonality-adjusted baseline to estimate next week's inquiry volume or move-in probability. This doesn't need to be complicated. The point is to create a number that reflects your actual house history instead of your gut feeling.
Then compare the baseline to what really happened. If your forecast was off, write down why. Maybe a nearby employer schedule changed, maybe the room was priced too high, or maybe the photos were stale.
Weeks 5 and 6, test and refine
Add one or two causal features, like a local event calendar or a competitor rent change. Then calculate your error in a simple way and keep a log. IBM's guidance to test multiple methods and monitor accuracy over time fits well here, because the value comes from repetition, not one perfect forecast IBM demand forecasting guidance.
A workable weekly rhythm looks like this:
- Audit data. Check lead counts, lease dates, and room status.
- Clean and structure. Remove duplicates and fix missing fields.
- Build the baseline. Start with the simplest useful forecast.
- Run the forecast. Estimate next week's room demand.
- Review and refine. Compare predicted versus actual and update the sheet.
By the end, you should have a forecast you can review every week in under an hour. That's the right scale for a host who manages a few rooms, not a corporate planning team.
Connecting the Forecast to Dynamic Pricing and PadPulse Workflows
A forecast is only useful if it changes what you do next. If next week's room demand looks strong, you can raise the listed price. If the outlook looks weak, you can discount earlier or re-engage leads before the vacancy grows old.
How the forecast turns into a decision
Start with one simple rule. If forecasted inquiry volume is high for next week, hold price or test a higher listing. If it drops, lower the price and push harder on outreach.
That decision chain matters more than the model itself. A clean forecast should trigger a pricing move, a message sequence, or a showing push. If it does none of those, it's just reporting.
The best forecast is the one that changes your next message before the room goes stale.
For room-by-room operators, dynamic pricing becomes practical. A host doesn't need a complicated revenue strategy to act well. They need a rule that links demand signals to the listing price and then to follow-up behavior. A helpful overview of that approach is available in this dynamic pricing strategy guide.
A simple worked flow
Say one room has been open for four days and the forecast says inquiry volume should soften next week. You lower the price, send a fresh message to past leads, and open more self-guided showing windows. If two leads respond, you can compare the move-in result against the forecast and learn whether the price cut was early enough.
That's the full loop.
- Forecast says demand is soft.
- Price drops or outreach increases.
- Leads re-engage.
- A move-in closes.
- NOI improves because the room stops sitting idle.
The key is to keep the forecast tied to action. If your team sees the same number every week but nothing changes in pricing or messaging, you're doing reporting, not forecasting.
Common Pitfalls and Best Practices to Avoid Them
A first forecast for a six-bedroom house often misses for the same reasons, and the fixes are usually simple. You do not need fancy software to avoid those errors. You need a steadier process and a clear link between the forecast and what you do next.
Five mistakes that show up fast
Too little history. A forecast built on a small sample can look precise and still be wrong. If you do not have enough room-level history to see seasonal patterns, keep the model simple and treat it as a draft, not a final answer.
Ignoring seasonality. A room that fills quickly in one month may slow down in another. If you do not adjust for calendar effects, the forecast will promise too much in slow periods and leave you short on preparation in busy ones.
Training on constrained sales. If a room was unavailable, the data will understate demand. Mark those periods clearly so the model does not mistake a supply problem for weak interest.
Treating the forecast like a single number. Room-by-room operators are better served by a range, especially when inquiry flow is uneven. A range gives you room to set price, plan outreach, and schedule showings without pretending the future is exact.
Never retraining. A forecast gets stale if nobody updates it. Weekly or monthly refreshes keep it aligned with the market and with your recent leasing results.
The method matters too. A structured judgment approach helps when the house is still light on history, while quantitative methods fit better once you have enough room-level data to trust patterns. One widely cited evidence-based forecasting framework recommends expert surveys, intentions surveys, judgmental bootstrapping, prediction markets, structured analogies, and simulated interaction when data are thin, then extrapolation, quantitative analogies, rule-based forecasting, and causal methods when the data are stronger.
For a small co-living house, the practical lesson is simple. Do not chase false precision. A forecast range is often more useful than a single point because it gives you room to set price, message leads, and schedule showings with more confidence.
Your 30/60/90-Day Forecasting Plan and the Bottom Line
The first 30 days should be about cleanup, not perfection. Gather inquiry logs, lease dates, pricing history, and vacancy reasons, then build a naive baseline and record your first error check. If you can tell whether the forecast was close or off, you've already started learning.
Days 31 to 60 are for adding the context that matters most, like seasonality, comp rents, and local events. Tie the forecast to one pricing rule so your number changes something real. That's when forecasting starts to affect occupancy instead of sitting beside it.
Days 61 to 90 are for tightening the loop. Review the forecast weekly, compare it to actual room activity, and expand the process to a second house if you have one. At that point, the habit matters more than the model, because the habit keeps the model honest.
The biggest mistake is assuming forecasting is a one-time project. It isn't. The host who keeps the loop going for a year usually sees a clearer read on demand, faster vacancy response, and stronger NOI than the host who keeps guessing room by room.
If you want a cleaner way to manage room-level pricing, messaging, access, and portfolio tracking in one place, join the PadPulse interest list at PadPulse. It's built for co-living operators who want forecasting to become part of the weekly workflow, not another spreadsheet they dread opening.