Local Market Intelligence: Boost Room Rental NOI
June 23, 2026
A lot of hosts hit the same wall. One room sits open for weeks, your listing looks fine, and nearby houses seem to stay full. You start asking the same questions every operator asks. Is the rent too high? Is the room too basic? Is demand soft in this area, or am I just marketing it wrong?
That's where local market intelligence helps.
If you run room-by-room rentals, broad city averages won't save you. A shared house near a bus line, hospital, warehouse corridor, or college can behave very differently from another property just a few ZIP codes away. The operators who fill rooms faster usually aren't guessing better. They're watching their local market more closely and adjusting faster.
This is the playbook I'd hand to a new host. Keep it simple, stay close to your neighborhood, and use the signals in front of you to protect occupancy and improve NOI.
What Is Local Market Intelligence Anyway
A new host usually starts with the obvious move. Open a few listings, scan the rents, copy a number that looks reasonable, and publish the room.
Then the room sits.
Local market intelligence is the habit of reading your immediate rental area closely enough to make better room-by-room decisions than a host who relies on broad city averages. For a co-living operator, that means watching the block, the nearby transit stop, the hospital corridor, the warehouse cluster, or the college edge that shapes who rents from you.
It works like running a house with a thermometer in each bedroom instead of one for the whole city. A metro average may say rents are up. It does not show whether furnished rooms with utilities included are getting picked up faster in your ZIP code, or whether a nearby operator just added better photos, lower deposits, and same-day move-in.
For room rental operators, the useful questions are practical:
- What are similar rooms nearby asking right now?
- Which listings fill fast, and which sit for days or weeks?
- What features matter most here, such as furnishings, parking, private baths, or flexible terms?
- Who is moving into this pocket of the city?
- What are renters comparing you against before they message or book?
The goal is pattern recognition. One listing does not mean much. Ten similar listings, tracked over a few weeks, start to show how your micro-market behaves.
New hosts often miss this part. They treat market research like a quick price check, when the actual objective is to spot cause and effect. If nearby rooms with locks, desks, and all-in pricing keep disappearing while basic unfurnished rooms linger, that is not random. It is a clue about what renters in your area value enough to act on.
This matters more in co-living because room-by-room performance shifts faster than traditional leasing. Small changes in price, furniture, lease flexibility, or response time can change whether a room fills this week or next month. City averages smooth over those differences. Room operators cannot afford to smooth them over.
A simple way to define it is this: local market intelligence is the set of neighborhood signals you use to decide what to charge, what to offer, and what to fix first.
If you want to get more systematic, tools like demand forecasting software for rental operators can help you organize those signals before vacancy days pile up. But the starting point is simpler than it sounds. Watch your local room market closely, compare like with like, and use what you learn to run each bedroom as its own little business.
How Market Intelligence Boosts Occupancy and NOI
A room can miss its target in small ways and still cost you a lot. You list at $775 because that worked two months ago. Nearby hosts start including faster Wi-Fi, a desk, and lower move-in costs. Your room still gets views, but fewer serious messages. One extra vacant week wipes out far more income than a small pricing or packaging change would have.
That is where local market intelligence pays off for a room-by-room operator. It helps you catch small shifts early, while they are still easy to fix.
A simple way to look at it is this: better local information helps you fill rooms faster, protect rent, and cut avoidable vacancy days. In co-living, those three pieces drive NOI more than almost anything else you do week to week.
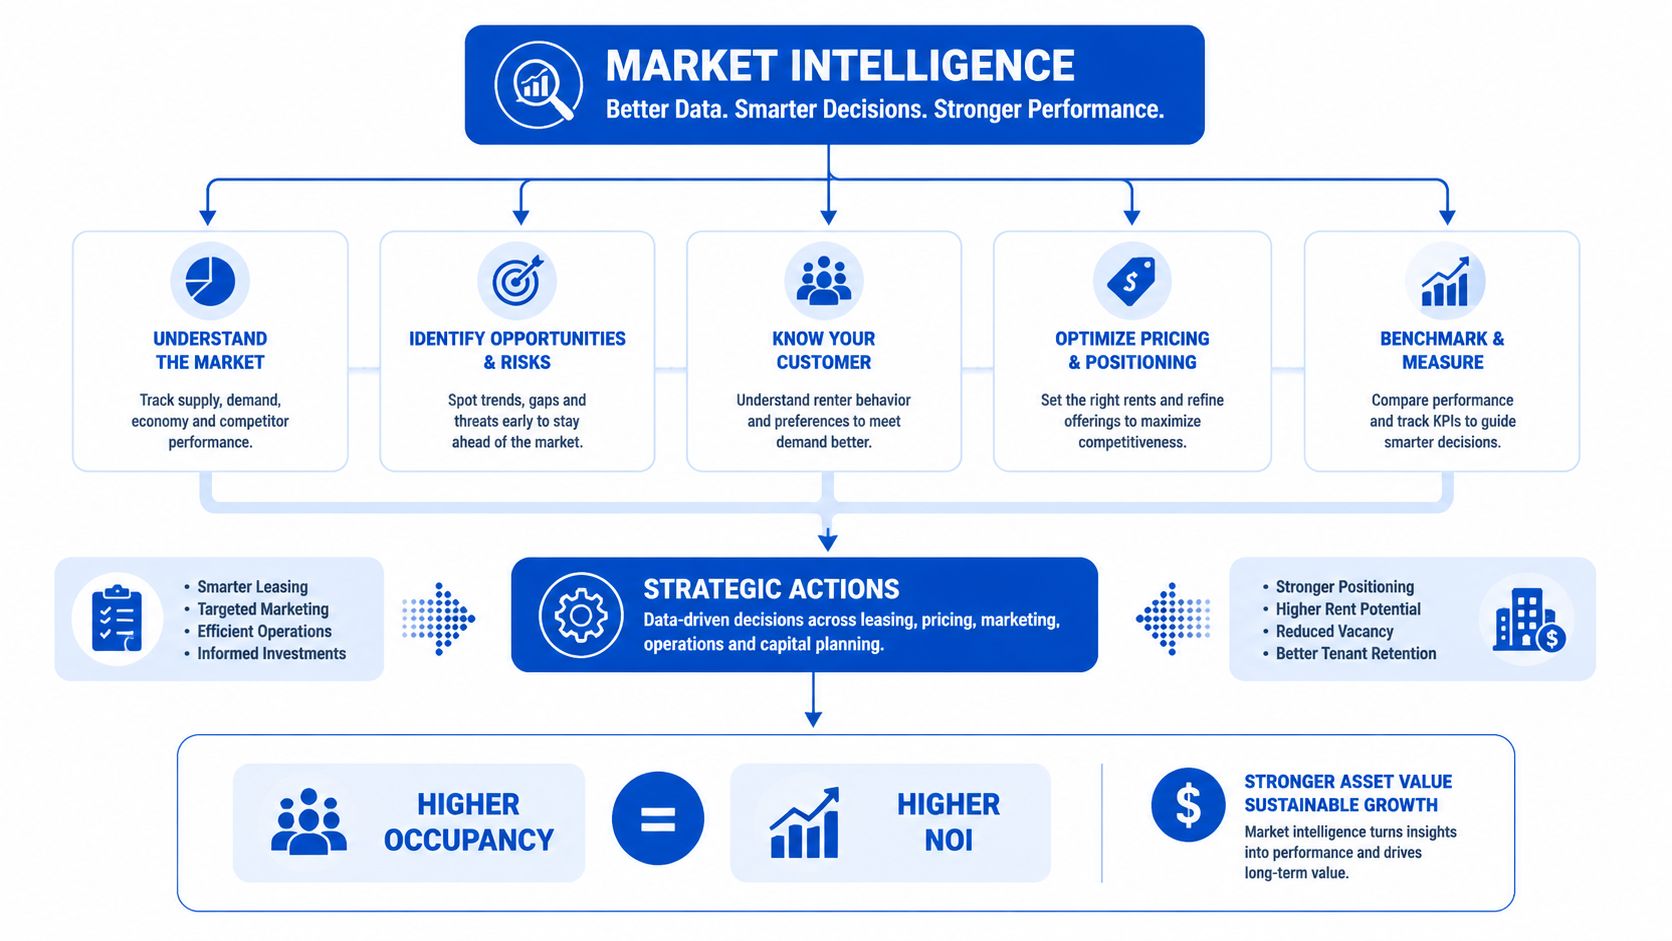
Better pricing protects revenue without slowing leasing
Pricing a room by city average is a little like setting the menu price for a corner coffee shop based on the whole state. The number may sound reasonable, but it misses what people on your block are comparing.
For room rentals, that gap matters fast. Renters are not choosing between abstract market averages. They are comparing your room to five or ten real options with similar commute times, furniture, privacy, and move-in terms. If your room is priced above nearby substitutes without offering a clear reason, inquiry volume softens. If it is priced too low, the room fills quickly but your monthly income stays below what the market would support.
This is especially true in neighborhoods where one side of town rents quickly and another sits longer, even inside the same city. Broad metro numbers smooth over that difference. A room operator needs the block-level version.
External analysts have noted the same pattern in broader local research. Submarket demand, vacancy conditions, and neighborhood-level benchmarks often matter more than citywide averages when operators make pricing decisions, as explained in this regional market analysis overview.
Faster adjustments usually beat perfect certainty
New hosts often wait for obvious proof before making a change. By then, the room has already been sitting.
Room-by-room leasing works more like airline pricing than a yearly apartment renewal. You do not need a dramatic market swing to act. A few days of weak inquiry, a spike in competing listings, or a pattern of prospects asking for the same feature can be enough to justify a test.
Market intelligence helps you spot four common profit leaks:
- Overpricing: the room stays empty longer than it should, and each open day reduces monthly income
- Underpricing: the room leases fast, but the lease starts below what your micro-market would have supported
- Weak positioning: your listing speaks too broadly instead of matching the renter profile your area attracts
- Late reactions: you notice local changes after competitors have already adjusted
A filled room at the right price point usually beats a stale listing held at a number the market stopped accepting.
Occupancy improves when the offer matches the renter
Higher occupancy is not only about dropping rent. Often, it comes from tightening the offer.
For example, if nearby rooms are filling because they include utilities, flexible start dates, and simple house rules, copying one of those features may improve your leasing speed more than a discount would. If renters in your area care about work-from-home setups, adding a desk and showing it clearly in photos can change the quality of leads you attract. The win comes from matching local demand, not guessing at it.
That is why room operators should track both price and package. The market is not only answering, "What should I charge?" It is also answering, "What should I include so this room feels easy to say yes to?"
If you want a practical system for reading those signals before vacancy stretches out, PadPulse's guide to demand forecasting software for rental operators gives a useful framework.
The Core Metrics Every Room Rental Operator Should Track
A new host often asks the same question after a room sits for ten days: "Should I cut the rent?" Sometimes yes. Often, that is the wrong first move.
The better question is, "Which part of the offer is out of sync with this micro-market?" For room-by-room operators, that answer usually comes from a small set of metrics you can review every week. You are not running a hedge fund. You are checking the dashboard on a house, one room at a time, to see what needs adjustment before vacancy gets expensive.
This visual gives the big picture first.
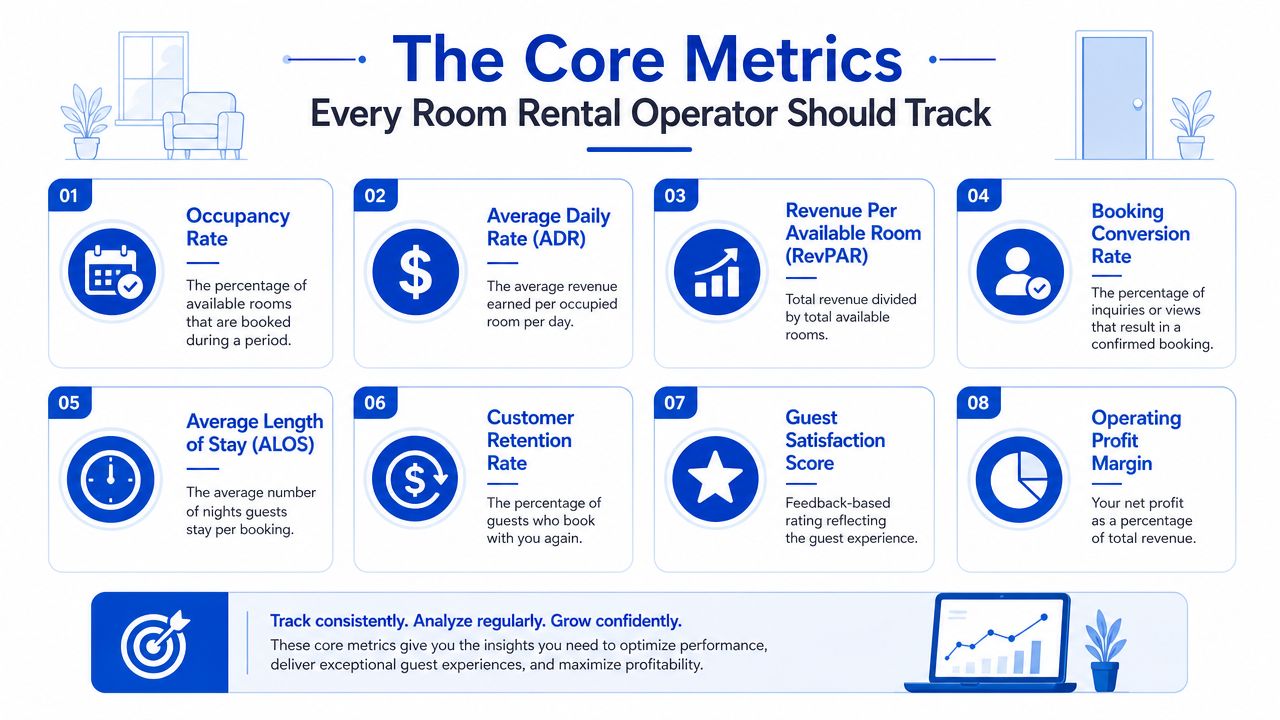
Five metrics that matter most
- Comparable rents
Start with the rooms a renter would compare against yours. That means same neighborhood or commute pattern, similar furnishing level, similar bathroom setup, similar lease terms, and similar inclusions like utilities, parking, laundry, or Wi-Fi.
A furnished room with utilities included near transit is a different product from an unfurnished room with a shared bath and a longer lease requirement. If you compare unlike products, your pricing decision gets noisy fast.
- Local demand signals
Demand usually shows up in small clues before it shows up in signed leases. Track inquiry volume, showing requests, reply rates, lead quality, and how quickly new nearby listings start getting traction.
These signals help you diagnose the problem. Plenty of views but weak inquiries often points to pricing or weak listing copy. Strong inquiries but missed showings often points to photos, room condition, scheduling friction, or a slow follow-up process.
- Lead times
Measure two clocks. First, how many days pass between publishing a room and getting a serious lead. Second, how many days pass between that lead and move-in.
Those two numbers help you plan with less stress. If your market usually needs more runway, you post earlier. If serious leads come in quickly but stall before move-in, you fix your screening, showing, or approval steps. If you want one place to track those patterns consistently, PadPulse has market research workflow tools for room rental operators that keep this from living in scattered notes and browser tabs.
Here's a quick explainer that can help newer operators think about performance signals in a structured way:
Two more metrics that round out the picture
- Seasonality
Every room business has timing patterns, even in markets that feel stable year-round. School calendars, internship cycles, local employers, weather, and relocation patterns all affect who is searching and when.
Keep this simple. Add monthly notes on lead volume, move-in timing, and lease speed. After a few months, you will stop treating every slow period like a pricing emergency.
- Competitor inventory
Count the nearby listings that compete with your room right now, then note what they are offering. A market with ten similar open rooms requires a different strategy than a market with three.
Pay attention to the package, not only the rent. If every nearby host includes utilities and furnished rooms, those are table stakes. If very few offer fast move-in approvals, flexible deposits, a desk setup, or cleaner common areas, those details can raise occupancy without forcing a discount.
A simple tracker can look like this:
| Metric | What to log | Why it matters |
|---|---|---|
| Comparable rents | Asking rent and features | Tells you if your price is in range |
| Demand signals | Inquiries and showing requests | Shows interest before occupancy changes |
| Lead times | Days from listing to lead, lead to move-in | Helps plan pricing and marketing timing |
| Seasonality | Notes by month and move cycle | Prevents false panic during slower periods |
| Competitor inventory | Number and quality of similar listings | Shows how crowded your local market is |
Why ZIP-level thinking matters
Citywide averages are too blunt for co-living and room rentals. Room demand changes block by block. One pocket may attract hospital staff who need furnished month-to-month options. Another may attract students who care more about budget, transit, and flexible move-in dates.
That is why ZIP-level or neighborhood-level tracking works better. As noted earlier in the article, segmentation data can help you sort areas by renter profile. In practice, keep it simple. Start with the few ZIP codes or submarkets where your leads already come from, then compare those pockets by rent, lease speed, and renter preferences.
The goal is practical, not academic. Track the local signals that help you fill the next room faster and at a stronger net operating income.
Practical Ways to Gather Local Market Data
Most hosts already have some market data. It's scattered across listing sites, text messages, call logs, notes, and memory. The job is to collect it in a repeatable way.
One useful framework is to split your sources into primary intelligence and secondary intelligence.
Primary intelligence from real conversations
Primary intelligence is what you gather directly.
According to Demandbase's overview of B2B market intelligence methods, common primary intelligence methods include surveys and interviews. For a room rental operator, that translates into direct renter conversations and feedback loops.
You can gather this without making it formal:
- Ask lost leads one question: Why didn't this room work for you?
- Ask current members what stood out: Price, location, cleanliness, privacy, house rules, transit, parking.
- Track repeated objections: Shared bath, deposit, room size, move-in timing, noise, furnishing level.
- Use simple intake forms: A short question on desired move date, budget range, and work location tells you a lot.
If three prospects in one week say your room is nice but too far from their commute, that's local intelligence. If several say they expected a desk and faster Wi-Fi, that's an operations clue.
When renter feedback repeats, treat it like a market signal, not just a one-off opinion.
Secondary intelligence from public signals
The same Demandbase source also notes that secondary intelligence often comes from competitor websites, press releases, financial reports, customer reviews, and social media.
For co-living operators, the most practical secondary sources are:
- Craigslist and Facebook Marketplace: Watch room counts, price changes, photo quality, and ad age.
- Competitor websites: Note lease terms, amenities, and how they position their rooms.
- Customer reviews: Reviews often reveal what renters value or complain about.
- Social media groups: Local housing groups show urgency, price sensitivity, and neighborhood concerns.
- Public datasets: Census ACS ZIP-level data helps you understand household patterns, age mix, and density.
If you want a structured place to organize this work, PadPulse's market research pipeline feature overview shows one way operators can centralize comparable rents, trends, and local signals.
A simple collection routine
Don't overbuild this. A weekly routine is enough for many operators.
Try this checklist:
- Monday: Scan fresh competitor listings in your ZIP and nearby pockets.
- Midweek: Review your inquiries, no-shows, and objections.
- Friday: Update your comp sheet and note any price changes around you.
- Month-end: Look for recurring themes, not isolated noise.
That rhythm keeps you close to the market without turning data collection into a second job.
Analyzing Your Data With Simple Dashboards
You check competitor listings on Monday, answer inquiries on Wednesday, and update your comp sheet on Friday. By the end of the month, you have plenty of notes but no quick way to see what changed. A simple dashboard solves that problem. It turns scattered observations into a control panel for each room.
Most room-by-room operators can build this in a spreadsheet. You are not trying to impress an analyst. You are trying to answer one practical question fast. Which room needs attention right now, and why?
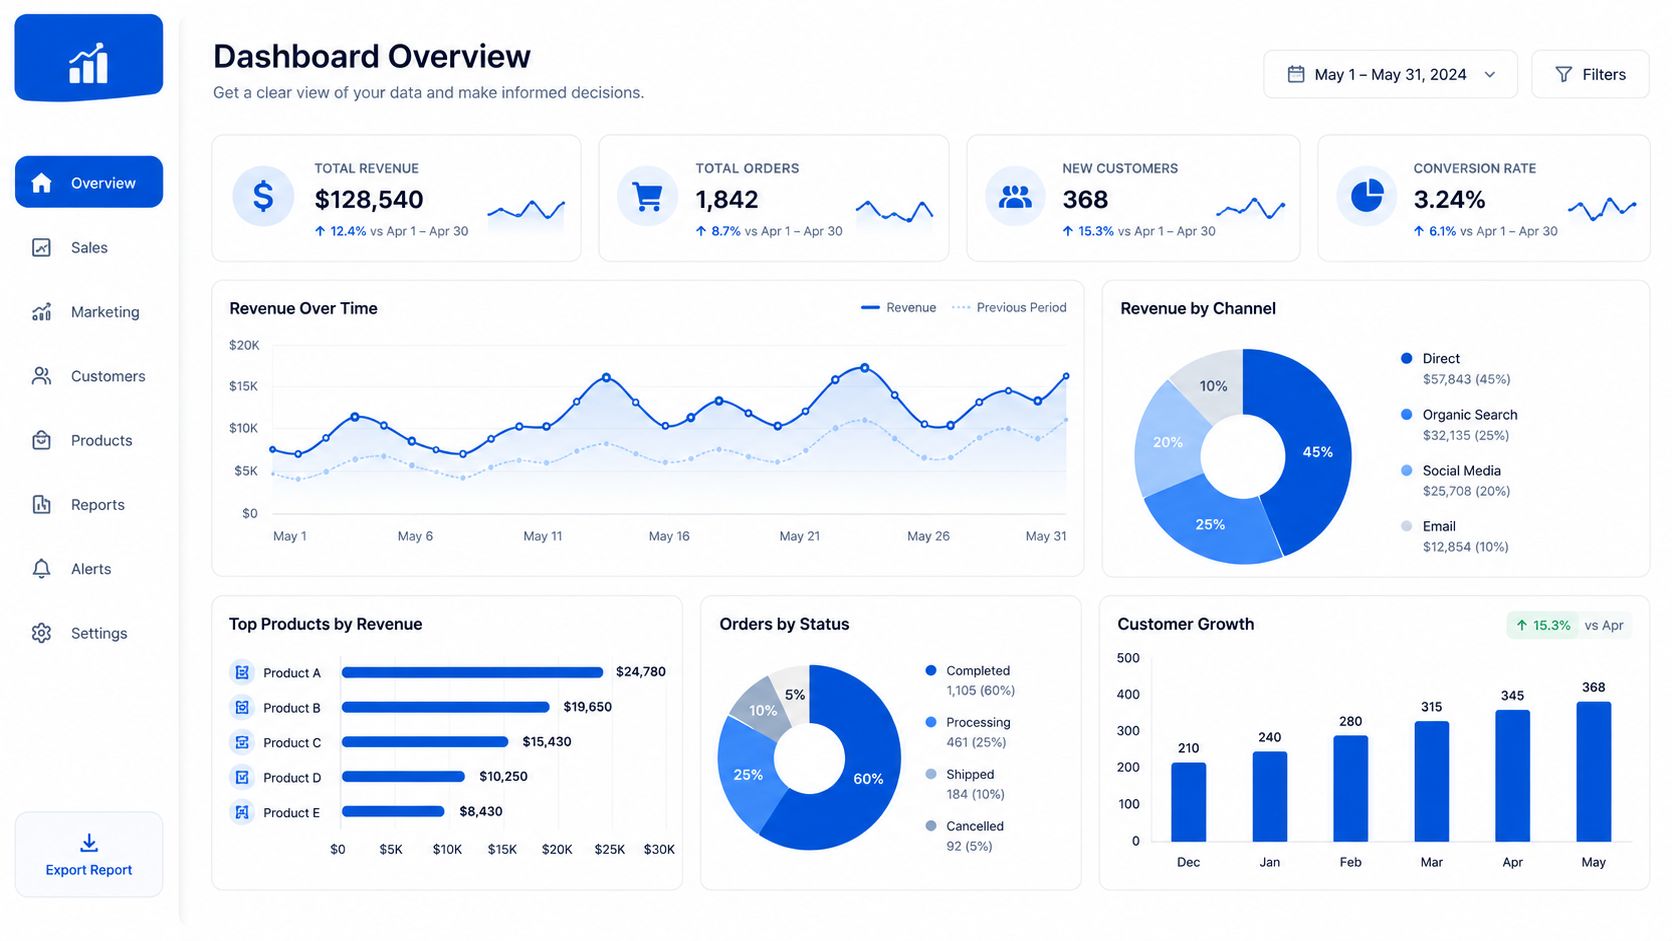
What to put on one screen
A good dashboard works like the instrument panel in a car. You do not need every possible reading. You need the few signals that help you steer before a small issue becomes a vacancy problem.
For a co-living host, that usually means tracking questions like these:
- Is this room priced inside the local comp range, or outside it?
- Are inquiries increasing, flat, or fading week over week?
- How many inquiries turn into showings?
- How long has each room been vacant?
- Which nearby listings changed price, added furniture, or started offering concessions?
- Which room types fill fastest in this house?
One simple tab can do the job:
| Field | Example use |
|---|---|
| Property and room name | Compare performance across rooms |
| Asking rent | Track your current price |
| Comp range | Keep a local benchmark beside your price |
| Inquiry count | Measure interest level |
| Showings scheduled | See if interest turns into action |
| Days vacant | Flag rooms that need intervention |
| Notes | Record objections or competitor moves |
If you manage several homes, keep the layout identical across all of them. That makes patterns easier to spot. You will notice, for example, that one house gets strong inquiry at the same rent where another house stalls. That usually points to a positioning issue, not a market-wide problem.
How to read the patterns
A dashboard is useful because it helps you separate noise from trend.
Say Room 3 had only two inquiries this week. On its own, that number does not mean much. But if inquiries have fallen for three straight weeks, two nearby comps cut rent, and your showing count is also slipping, you have a clear pattern. The room is losing traction.
Now flip the example. If inquiries are healthy but prospects stop after the showing, the problem is probably not price alone. It may be the photos, the room setup, the smell, the roommate mix, or the way the showing is handled. Your dashboard helps you diagnose the bottleneck instead of guessing.
That is the core job here. Spot the step where the renter drops off.
Keep it simple enough to use weekly
Many new hosts build dashboards that are too detailed to maintain. Then they stop updating them, which makes the whole system useless.
Start with metrics you can collect in 15 minutes each week. If a field does not help you make a pricing, marketing, or operations decision, remove it. Clean and current beats complicated and stale every time.
Operator shortcut: If you cannot tell within one minute whether a room is overpriced, poorly marketed, or just early in its leasing cycle, the dashboard needs fewer fields and clearer signals.
Operators across real estate and hospitality have increasingly shifted toward using dashboards and outside market tools because internal notes alone leave too many blind spots, as noted earlier. For room rental hosts, the takeaway is simple. Your own inquiry log tells you what is happening inside your house. Your comp tracker shows whether the market around you is changing at the same time.
If you want a stronger setup across several properties, this guide to tracking portfolio performance across homes and units shows how to compare properties without losing room-level detail.
Turning Insights into Action with PadPulse
Data gets expensive when it sits in a spreadsheet and nobody changes anything. The useful part is turning your observations into simple rules.
The cleanest way to do that is with if-then decisions.

Use simple if-then rules
Here are examples a new host can understand and apply:
- If a room has weak inquiry volume and nearby comparable rooms are priced lower, then adjust the asking rent or improve the included value.
- If inquiries are strong but showings don't convert, then review photos, room presentation, and showing process.
- If prospects keep asking about the same missing feature, then decide whether that feature deserves a small capex upgrade.
- If one room type fills much faster than another, then review whether the slower unit is mismatched on price, furniture, or target renter.
These aren't perfect rules. They're operating rules. That's enough.
Treat changes like experiments
Local market intelligence is most reliable when it's built from triangulated, repeated signals. Practitioners recommend validating patterns across more than one cycle and treating pricing or positioning changes as experiments with an outcome window of about 30 to 60 days, because markets can shift faster than quarterly reviews, according to this guide on leveraging local market intelligence for smarter decisions.
That advice fits room rentals well.
If you lower price, upgrade photos, and tighten your response process all at once, you won't know what worked. Make cleaner tests when you can. Change one major variable, then watch results.
Most hosts don't need perfect analysis. They need a repeatable habit of making one clear adjustment, then measuring what happened.
Where PadPulse fits
PadPulse is one option for operators who want to move from manual tracking to a more centralized workflow. Based on its published product description, the platform is being built for PadSplit hosts and co-living operators and is expected to include dynamic pricing, market intelligence on comparable rents and demand, messaging workflows, and portfolio analytics.
That matters because once you already know your decision rules, software can help you apply them more consistently. Instead of checking every listing manually and reacting late, you can build a process where pricing, communication, and reporting stay tied to the same local signals.
The key idea is simple. Insight has to reach the action point. Otherwise it's just an interesting spreadsheet.
Making Market Intelligence a Habit
A good host usually loses money in a familiar way. A room sits open for two weeks. You check the listing a few times, make a price change, maybe swap a photo, then wait. By the time you realize demand softened or a nearby operator added better-furnished rooms at the same price, the vacancy already cost you.
That is why market intelligence has to live inside your weekly routine.
For room-by-room operators, this habit works like checking a thermostat. You are not trying to predict the whole housing market. You are checking a few signals often enough to catch small shifts before they turn into expensive vacancies. The goal is simple. Notice changes early, make one smart adjustment, and protect occupancy and NOI.
Keep the routine small enough that you will do it.
A simple cadence that works
Start with four habits:
- Check local comps once a week: Look at the same ZIP, a similar room setup, and the same renter profile.
- Log renter objections: Note whether prospects mention price, bathroom sharing, parking, furnishings, commute, or move-in timing.
- Review one monthly dashboard: Focus on occupancy, days vacant, inquiry volume, close rate, and average achieved rent.
- Make one meaningful change at a time: Then give it time to show a result before changing something else.
This is the part new hosts often miss. The habit is not "collect more data." The habit is "collect the few signals that help me make the next decision."
What changes when you do this consistently
Vacancies stop feeling random.
You start seeing patterns sooner. If inquiries are steady but tours are weak, the problem may be your listing or response flow. If tours happen but prospects hesitate at the last step, your pricing, house rules, or room setup may be out of line with nearby options. If everything slows at once, the neighborhood may have added competing inventory.
Those are useful questions for a co-living operator because they point to fixes you can act on this week, not vague theories you cannot use.
Hosts who stay close to their block, their renter type, and their comp set usually make cleaner decisions. They do not need a giant research process. They need a short repeatable loop. Check the market, record what renters are telling you, review performance, adjust, repeat.
If you want a simpler way to manage room-by-room pricing, market tracking, messaging, and performance in one place, join the PadPulse interest list. It's built for PadSplit hosts and co-living operators who want clearer local signals and a tighter system for turning those signals into better occupancy and NOI.