Portfolio Performance Tracking for Co-Living: A Guide
June 16, 2026
You open your spreadsheet, see strong occupancy, and still can't answer the question that matters most. Is this portfolio getting healthier, or are you just staying busy?
That's a common problem in room-by-room rentals. A house can look full while collections slip, turn times drag, utility waste climbs, and one underperforming room eats the margin from three strong ones. Traditional rental tracking misses that because it treats the property like a stable unit. Co-living doesn't behave that way.
Portfolio performance tracking for this model has to follow operations as closely as it follows finances. If you run PadSplit-style housing, your results come from pricing, churn, room readiness, collections, maintenance response, and the speed of move-ins. Those are operating drivers first, investment outcomes second.
Beyond ROI Why Co-Living Needs a Different Playbook
A lot of landlords start with simple ROI, rent collected, and maybe occupancy by property. That works better for traditional rentals where leases are longer and daily operations are lighter. It breaks down fast in shared housing.
A co-living portfolio behaves more like an operating business. You're not just leasing an asset. You're managing many small revenue streams, frequent member transitions, recurring service issues, and room-level variability inside the same house.
Why simple ROI hides the real story
If one property shows high occupancy, that sounds good. But high occupancy alone doesn't tell you:
- Whether the occupied rooms are priced well
- Whether residents are paying on time
- Whether turnover costs are eating your margin
- Whether utilities and maintenance are rising faster than revenue
- Whether the portfolio is improving or just cycling through avoidable churn
That's why private-market portfolio monitoring matters here. In shared housing, the focus shifts away from market benchmarks and toward operating KPIs like occupancy, delinquency, rent growth, and maintenance margins, with financial and operational metrics tracked together, as described in Allvue's overview of portfolio monitoring for private markets.
If you only track gross rent and bank balance, you'll miss the difference between a property that's efficient and one that's surviving on constant move-ins.
What matters more than headline revenue
The better question is this: what drove the result?
Was revenue up because your pricing improved? Because a vacant room finally filled? Because one month had fewer repairs? Because deposits or move-in timing made the cash picture look stronger than the operation really was?
Practical rule: In co-living, revenue is an outcome. Operations are the cause.
That's why I prefer a tracking model that starts at the room level, rolls up to the property, and then rolls up again to the portfolio. It also helps to understand the gap between gross rent and what the property keeps. A useful primer is this breakdown of gross effective income, because many operators overestimate performance before they've accounted for vacancy and collection leakage.
Traditional real estate advice often assumes the property is the unit of analysis. In room-by-room rentals, the room is the unit of analysis, the house is the operating container, and the portfolio is where patterns show up.
Defining Your Co-Living KPIs From Room to Portfolio
A six-bedroom house can look fine on a monthly revenue report and still underperform the rest of the portfolio. Two rooms may have turned twice, one may have sat offline for repairs, and another may be occupied by a member who is already late. If those details are hidden inside one property total, you miss the reason the house is slipping.
That is why co-living KPIs need to stack in layers. Start at the room, roll up to the house, then review the portfolio. In PadSplit-style operations, profit is shaped by turnover speed, occupancy stability, collections, and operating discipline more than by headline rent alone.
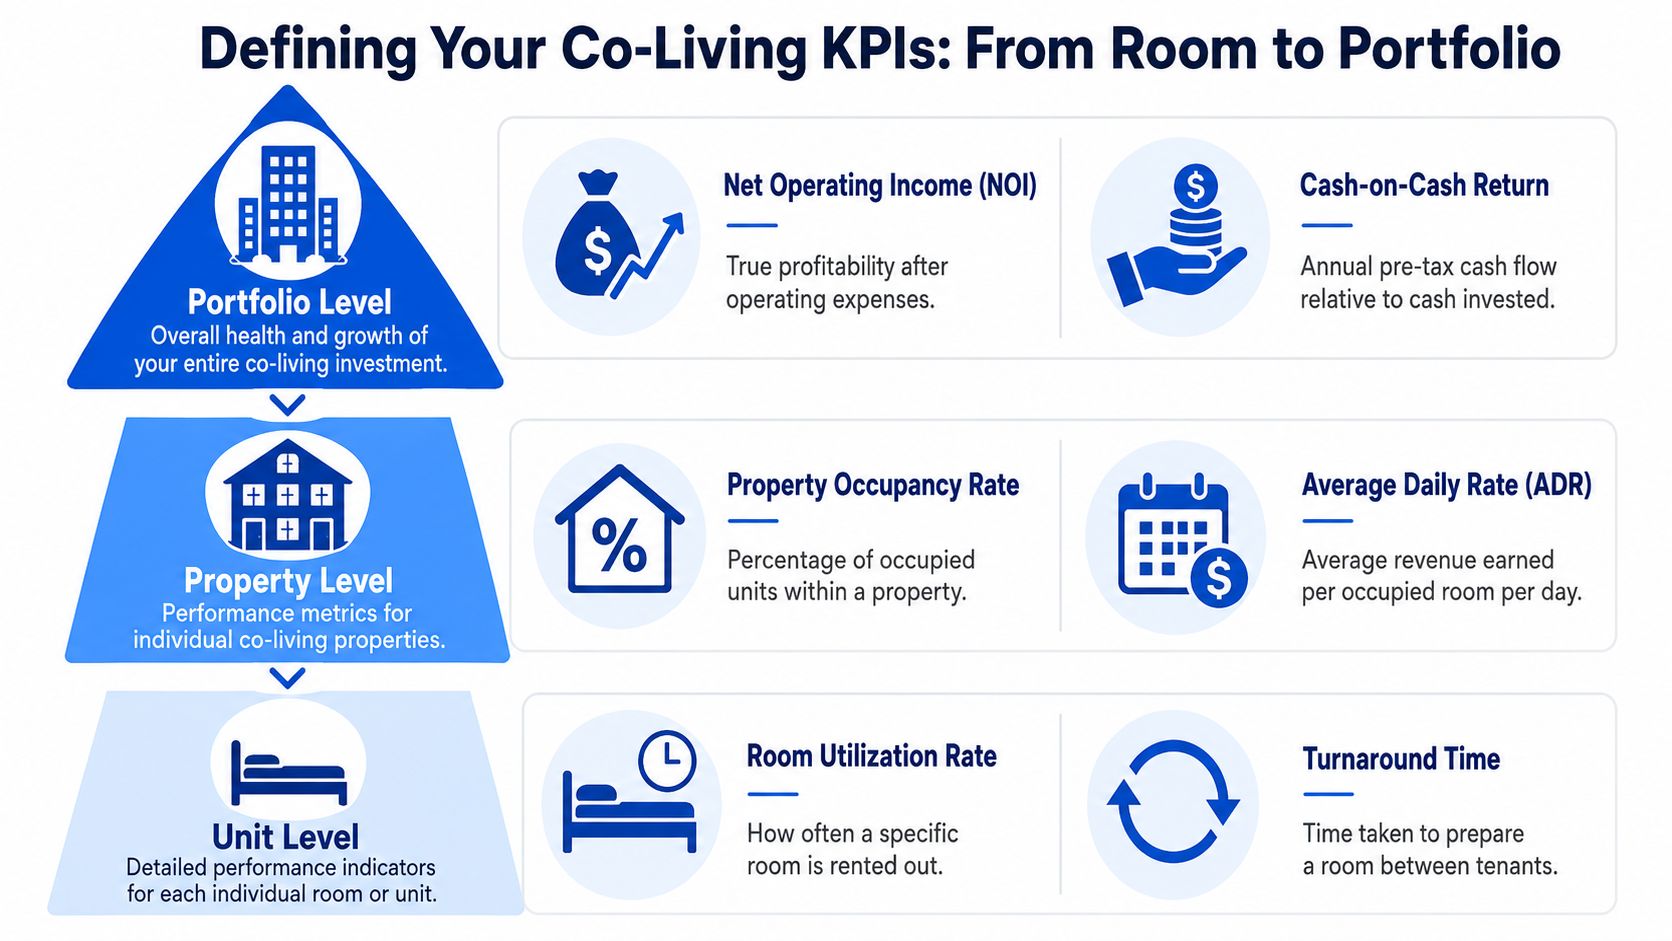
Unit-level metrics that expose hidden problems
At the room level, I'd track these first:
| KPI | Calculation | What It Tells You |
|---|---|---|
| Occupancy Rate | Occupied room days ÷ available room days | How consistently a room is filled |
| Rent per Room | Total room rent collected ÷ number of occupied rooms | Whether pricing is holding at the room level |
| Room Utilization | Days rented ÷ total days in period | How much each room actually produced |
| Turnaround Time | Days from move-out to next move-in readiness | How quickly operations restore inventory |
| Churn Rate | Move-outs during period ÷ occupied rooms or members during period | Whether instability is creating drag |
These metrics are simple, but they expose issues fast.
A room with strong advertised rent can still be one of the weakest rooms in the house if it goes dark for ten days after every move-out. Another room may rent for less but produce more cash over a quarter because it stays occupied, collects cleanly, and turns in two days instead of seven. That is the kind of trade-off operators need to see.
I also separate vacancy into two types whenever possible. One is market vacancy, where demand is weak. The other is operational vacancy, where the room could have been rented but was blocked by cleaning, maintenance, inspection delays, or leasing follow-up. In co-living, that distinction matters because the fix is different.
Property-level metrics that connect operations to money
At the house level, NOI still matters. It remains the clearest measure of whether the property is producing profit after normal operating expenses.
But for co-living, NOI only helps when you can explain what caused it. I want to see these inputs beside the house-level profit number:
- Occupancy by house
- Average realized rent per occupied room
- Collections or delinquency rate
- Turnaround days by move-out
- Maintenance cost per occupied room
- Utility cost per occupied room or per house
- Bed count versus occupied bed count
Those inputs keep operators from making the wrong call. A full house with high utility usage, frequent delinquency, and constant room turns can produce worse NOI than a house running at slightly lower occupancy with better member retention and tighter cost control.
Many hosts benefit from reviewing a clear P&L report example for rental properties, because it connects room activity to house-level profitability instead of treating the P&L as a separate accounting exercise.
Portfolio-level KPIs that guide strategy
At the portfolio level, the goal is not to collect more numbers. It is to spot patterns across houses and decide where to intervene.
I'd keep the portfolio view focused on five questions:
Is occupancy improving or slipping across the portfolio?
This shows whether leasing performance is strengthening, whether a seasonality pattern is emerging, or whether one weak property is pulling down the group.Is portfolio NOI improving with scale?
More houses should create better systems, not just more activity. If revenue grows while NOI margin stalls, operating complexity is probably outrunning process discipline.Are move-outs and turns concentrated in a few houses?
Portfolio churn rarely spreads evenly. One property manager, one bad house rule set, or one maintenance bottleneck can create a cluster of avoidable turnover.Which houses are consistently healthiest after adjusting for their size? Compare houses on a per-room or per-bed basis so a larger property does not look better because it has more doors.
Which houses deserve immediate attention?
A weighted property score can help here. I usually rank houses using occupancy, collected revenue, delinquency, turn speed, maintenance burden, and NOI margin. The exact weights depend on the business. A stabilized portfolio may prioritize margin and retention. A lease-up portfolio may put more weight on occupancy and speed to fill.
That weighted score does not need to be fancy. It just needs to reflect how the operation wins.
For example, a house with 92% occupancy might rank below one at 88% if the first property has slower turns, heavier delinquency, and higher maintenance cost per occupied room. Traditional rental tracking often stops at rent collected and occupancy. Co-living operators need a sharper view because room-by-room performance can drift long before the property-level total makes the problem obvious.
Building Your Performance Tracking System
A co-living portfolio can look fine on a month-end P&L while money is leaking every week. Three rooms sit in turn longer than planned. One house manager lets delinquency age. A maintenance backlog slows fills at two properties. If the tracking system only shows total revenue and total expenses, those problems stay hidden until they hit NOI.
The fix is a system built for room-by-room operations, not a generic rental dashboard.
Build one source of truth
PadSplit-style rentals create data in several places every day. Occupancy changes by room, not just by property. Turns happen faster. Communication volume is higher. Utility and maintenance costs swing harder when house rules or operations slip. A workable tracking system brings that activity into one place so the team can trust the numbers and act on them.
Pull from the sources where the operation is performed:
- Rental platform reports for occupancy, bookings, collections, and member activity
- Bank and accounting records for posted income and expenses
- Utility bills for usage and cost drift
- Maintenance logs for repeat issues, open work orders, and turn blockers
- Smart-home tools like keyless locks and HVAC controls for access events and energy usage
- Messaging records for leasing response times and follow-up gaps
I do not try to collect every available field. I want the fields that explain performance fast and hold up under review.
Fragmented data causes real operating problems. In practice, separate spreadsheets, manual exports, and property-by-property naming inconsistencies lead teams to debate numbers instead of fixing vacancies, collections, or turns. A single master repository prevents that. It also makes KPI definitions consistent across the portfolio.
What the dashboard should show at a glance
A good dashboard helps answer two questions quickly. What needs attention today? What trend is getting better or worse?
At the portfolio level, keep these visible:
- Occupancy by property
- NOI trend by property and portfolio
- Delinquency watchlist
- Rooms offline or in turn
- Utility and maintenance outliers
- Recent pricing changes and resulting performance
- Health score by house
Then let the team drill into each property:
- room status
- move-in and move-out timeline
- overdue balances
- maintenance backlog
- realized rent by room
- turn duration
- message response or lead follow-up gaps
If you are still comparing systems, this guide on what property management software is helps frame the trade-offs around centralization, reporting, and workflow coverage.
The dashboard should reduce decisions, not create more of them.
What works and what doesn't
What works:
- Automated imports instead of hand-keyed monthly updates
- Consistent room naming so reports match leasing, maintenance, and accounting records
- One definition per KPI so occupancy, delinquency, and turn time mean the same thing to every manager
- Property drill-downs that help the team find the cause of a problem in minutes
What doesn't:
- Separate spreadsheets by property with different formulas
- Manual status updates for turns and vacancies
- Looking only at month-end totals
- Tracking revenue without operating context
The trade-off is simple. A more connected system takes work to set up, but it saves hours of cleanup and catches issues earlier. In co-living, that matters because profitability depends on small operational moves repeated across dozens or hundreds of rooms. A missed turn date, slow lead response, or recurring maintenance issue can drag a house down before the monthly summary makes it obvious.
From Data to Decisions With Reporting and Alerts
Monday at 9 a.m. is when weak reporting shows up. The leasing lead says traffic is fine. Maintenance says turns are moving. Finance says collections slipped. If those teams are looking at different numbers, the portfolio drifts even when everyone is working hard.
Co-living needs a tighter reporting rhythm because room-by-room problems spread fast. A single delayed make-ready can hold back one room, then drag down house occupancy, then force pricing decisions that hurt realized rent. The goal is not more reporting. The goal is faster intervention.
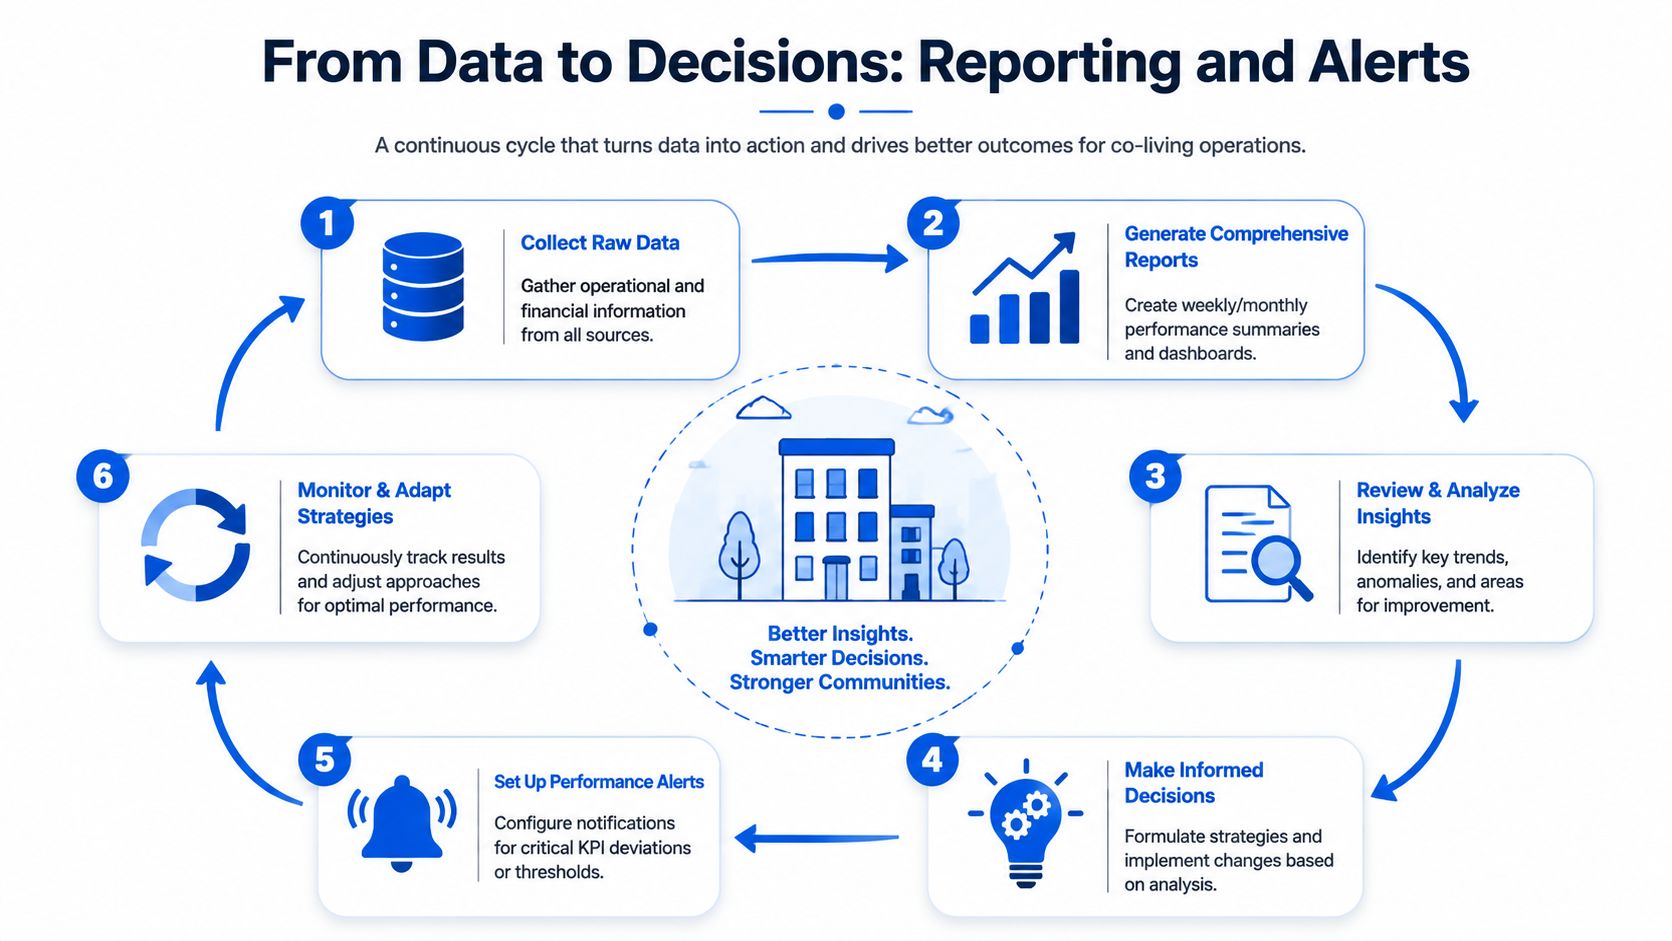
Use different cadences for different decisions
The cadence should match the decision.
Weekly operational review
Review exceptions that can change occupancy in the next 7 to 14 days. Focus on rooms stuck in turn, pending applications, overdue balances, open work orders tied to vacant rooms, and any house with unusual move-out volume. This meeting should be short and specific. Who owns the issue, what changed since last week, and when does it get resolved?
Monthly financial review
Review NOI, realized rent by occupied room, concessions, delinquency, utilities, maintenance spend, and variance to budget. Monthly review is where operators catch a common co-living problem. Occupancy looks acceptable, but margin is getting thinner because turn costs, underpricing, or bad collections are eating the gain.
Quarterly alignment audit Reconsider the bigger pattern. Are the properties you expected to stabilize stabilizing? Are recent pricing changes improving collections, or just filling rooms with weaker fit? Are some houses producing too much operational friction for the yield they generate? Quarterly review matters because a PadSplit-style portfolio can look busy and still move in the wrong direction.
One practice that helps here is cohort analysis. Group houses by onboarding date, pricing reset, operator, or process change, then compare what happened after the change. That is often how you separate a real improvement from a lucky month.
Alerts are what make the system usable
A dashboard is passive. Alerts create action.
In co-living, I want alerts tied to thresholds the team can control. If the threshold does not lead to a decision, it becomes noise. If it fires too late, it misses the point.
The section below is worth watching if you want a visual walkthrough of how reporting can support better operating decisions.
Useful alerts include:
- Occupancy drop alert when a house or room falls below your acceptable level
- Turnaround delay alert when a room stays offline longer than expected
- High-cost alert when utilities or maintenance spike outside normal range
- Collections alert when delinquency starts building
- Health score decline alert when a property weakens across several KPIs at once
For example, if a 12-bed house drops from 11 occupied rooms to 9, that is not just an occupancy issue. It may point to slower lead follow-up, a bad turn handoff, pricing that no longer matches the room mix, or resident experience problems causing churn. A good alert should send the manager straight to the likely cause, not just flash red on the dashboard.
A useful alert doesn't tell you everything. It tells you where to look first.
That is the shift. Instead of giving every property the same attention, you manage by exception. Stable houses stay on course. The team spends time where one fix can recover revenue, shorten vacancy, or stop a churn pattern before it spreads.
Common Portfolio Tracking Pitfalls and How to Fix Them
Most operators don't fail because they ignore performance. They fail because they track the wrong things, or they trust numbers that answer the wrong question.
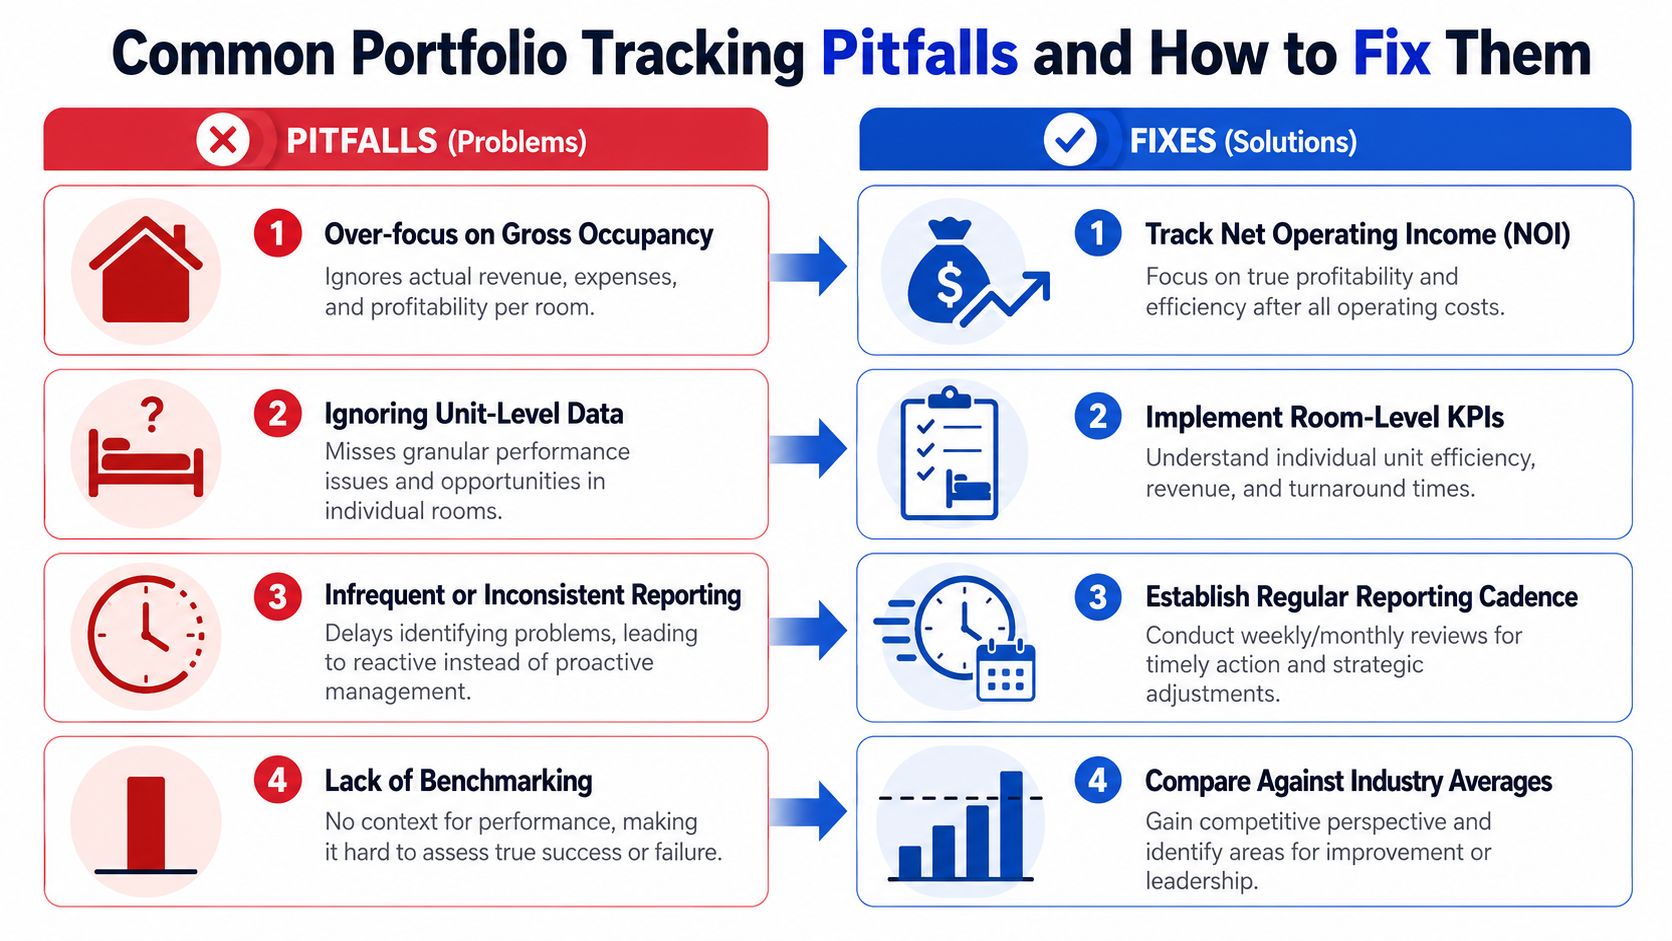
Pitfall one: celebrating occupancy while NOI slips
The red flag is familiar. Most rooms are filled, but cash feels tight and the property isn't retaining margin.
That usually means occupancy has become a vanity metric. The operator is watching filled beds, not realized income after operating costs.
Fix it by reviewing occupancy alongside realized room rent, delinquency, utilities, maintenance, and NOI. If occupancy rises while NOI weakens, the extra heads in beds may be coming with poor pricing, more wear, or weaker collections.
Pitfall two: ignoring room-level variance
A house average hides weak rooms. One small bedroom with repeated vacancy, resident mismatch, or slower turns can underperform for months without showing up in top-line property numbers.
Use room-level KPIs consistently. Compare each room's occupancy, rent, turn time, and maintenance history. In co-living, portfolio performance tracking gets sharper when you identify whether the issue is the house, the room type, the price point, or the process around that unit.
Pitfall three: inconsistent inputs
When one person counts a room as occupied at booking and another counts it at move-in, the trend line becomes unreliable. The same goes for maintenance coding, turn status, and timing of revenue recognition.
The fix isn't more reporting. It's cleaner definitions.
Create one operating dictionary for your portfolio:
- Occupied means what exact status?
- Vacant means ready to lease, or not occupied?
- Turnaround starts and ends when
- Collections count on invoice date or cash receipt
- Maintenance categories mean what exactly
Once those definitions are stable, your comparisons become useful.
Pitfall four: mistaking cash-flow noise for operating skill
This is one of the biggest traps in performance reporting. A period can look strong because of deposits, withdrawals, staged move-ins, or timing of rent collections, even if the underlying operation didn't improve.
Financial Edge notes that cash flows can significantly affect results and that time-weighted and money-weighted returns measure different outcomes. In practical terms, headline return can mislead operators who need to know whether management changes improved underlying performance, as discussed in this review of portfolio monitoring methods.
For co-living operators, that means a strong month may reflect timing:
- Several move-ins landed at once
- Deposits boosted cash temporarily
- Collections caught up from prior periods
- An expense hit the following month instead of this one
The fix is to separate operating performance from cash timing. Review NOI trends, occupancy quality, delinquency, and turn efficiency alongside any return figure. If the cash result improved but the operating KPIs did not, don't assume the business got better.
Strong cash this month doesn't always mean strong management this month.
Your Path to a Purposeful Portfolio
Good portfolio performance tracking isn't about building the biggest spreadsheet in your business. It's about creating a system that tells you what's working, what's slipping, and where to act next.
For co-living, that system has to reflect how the business runs. The room matters. The turn matters. Collections matter. Utility control matters. Resident churn matters. If you only look at property-level revenue, you'll miss the operational leaks that shape portfolio outcomes.
A practical setup has three parts.
Start with the right scorecard
Choose KPIs that connect day-to-day operations to financial results. Track room occupancy, realized room rent, turnaround time, churn, delinquency, maintenance burden, and NOI. Then roll those metrics up by property and portfolio.
This gives you a cleaner answer to a hard question. Is this property performing well because it's efficient, or because timing made the month look better than it was?
Centralize the data
Pull information into one place. Don't rely on scattered spreadsheets, text messages, invoices, and memory. When the data is fragmented, operators spend too much time reconciling reports and not enough time solving problems.
For room-by-room rentals, centralization matters even more because the moving parts are constant. Pricing changes, resident messages, access events, work orders, and financial entries all shape the result.
Let the system surface exceptions
The best operators don't manually scan everything forever. They define what healthy looks like, then set alerts for deviations.
If occupancy drops, if a room stays offline too long, if utility costs jump, or if a property's health score weakens, the system should raise its hand. That lowers stress and improves response time because your attention goes where it has the highest value.
The payoff is bigger than better reporting. A well-tracked portfolio is easier to run. Decisions get faster. Problems get spotted earlier. Growth becomes less chaotic because the portfolio has a clear operating language.
That's what a purposeful portfolio looks like. Not just active. Aligned.
If you want a platform built specifically for PadSplit hosts and co-living operators, PadPulse is worth a look. It's being developed as an all-in-one system for room-by-room operations, with planned tools for pricing, messaging, smart-home integrations, P&L tracking, and portfolio analytics. You can join the early adopter interest list to get updates, limited beta access, and launch news.