Profit and Loss for Rental Property: A Co-Living Guide
July 11, 2026
Rent hits your account. A cleaner gets paid. The utility bill clears. Someone moves out, someone new moves in, and the house feels busy enough that you assume the property must be doing fine.
Then tax season or a refinance request forces you to look closer, and the numbers don't line up with the feeling.
That gap is where most room-by-room operators get stuck. Cash in the bank isn't the same as profit and loss for rental property. In co-living, the gap gets wider because income arrives one room at a time while many costs sit at the house level. If you don't break those pieces apart, you can't tell whether the property has a pricing problem, an occupancy problem, or a cost-control problem.
Why Your Rental P&L Is More Than Just a Spreadsheet
A rental P&L isn't bookkeeping for bookkeeping's sake. It's the document that tells you whether your property is performing.
Many hosts start by checking one thing. Did more money come in this month than go out? That feels practical, but it hides the full picture. A large repair can distort one month. Prepaid expenses can make another month look better than it is. A partially vacant house can still look healthy if a few rooms are priced high enough to mask the loss.
Cash movement is not operating performance
If you run a co-living house, you need to separate three ideas:
- Cash flow: What moved through the bank account.
- Operating performance: What the property earned and spent to run the house.
- Tax result: What your records show after accounting rules and deductions.
Those numbers overlap, but they aren't identical.
According to industry analysis of IRS Schedule E rental results, over 50% of Schedule E forms filed annually by rental property owners report a net loss. Yet the same analysis notes that a single property that does achieve profitability averages about $10,530 in annual profit with a 30.8% net margin after excluding depreciation and financing costs. That contrast matters. Plenty of landlords stay busy without building a strong business. The profitable operators know their numbers.
Practical rule: If you can't explain why one room, one house, or one expense category changed month to month, you don't have a usable P&L yet.
A good P&L changes decisions
Once the report is clean, you stop guessing. You can see whether vacant days hurt more than utilities, whether a premium room justifies furnished upgrades, or whether recurring maintenance is turning into deferred capital work.
If you're still managing this with disconnected sheets and bank exports, it helps to understand what property management software actually does before the reporting problem grows with each added room.
Deconstructing the Co-Living Profit and Loss Statement
The basic formula is simple. Income minus expenses equals profit or loss. The hard part is structure.
In a traditional single-tenant rental, one lease usually means one rent amount and a cleaner income line. In co-living, your rental revenue comes from several room agreements, move-in fees, late fees, utility reimbursements, and occasional add-ons. Your expenses are also mixed. Some belong to a specific room. Others support the whole house.
Start with the top line
Your co-living P&L should begin with all income tied to that property for the period. For most operators, that means:
- Room rent: The main revenue source, tracked by room rather than by property only.
- Other collected income: Late fees, application-related charges, utility surcharges, parking, laundry, or furnished-room add-ons.
- Adjustments for vacancy or nonpayment: If a room sat empty or rent wasn't collected, the property didn't earn that revenue.
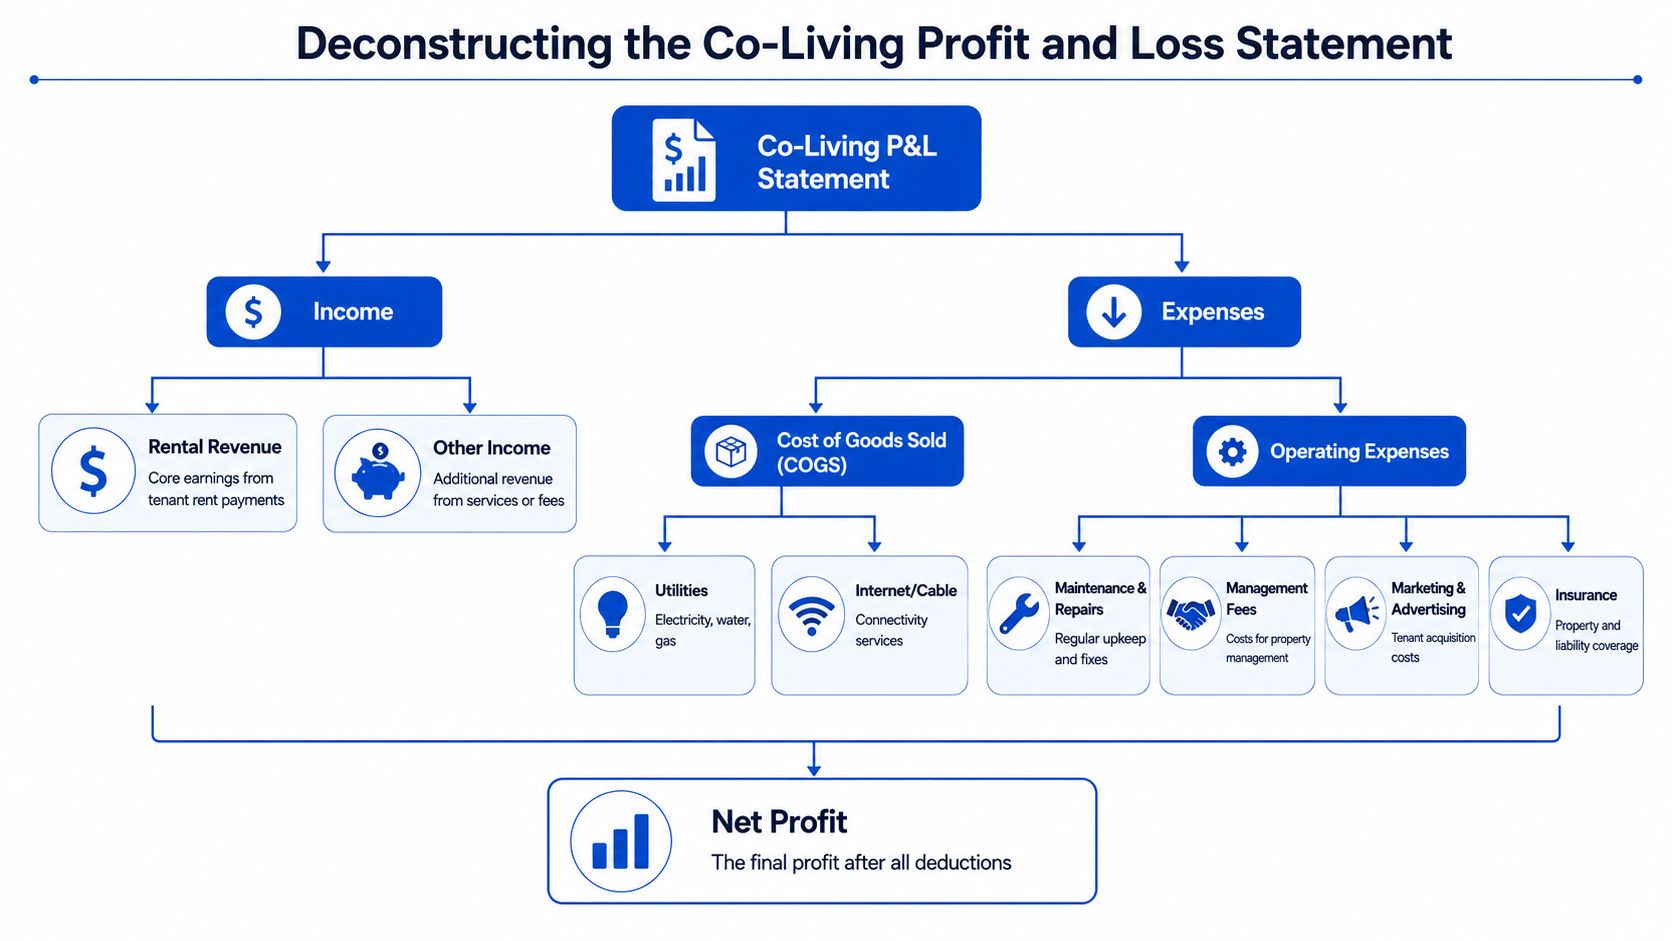
A beginner mistake is treating the house like one blob. That works until one room underperforms and you can't see it.
Break expenses into useful buckets
The cleanest room-by-room P&L usually uses three layers of expense tracking.
Direct room costs
These are costs tied to one room or one turnover.
Examples include:
- Room-specific repairs: Replacing a broken lock, repainting one bedroom, fixing damage inside that room.
- Turn costs: Bedding replacement, touch-up cleaning, tenant-ready supplies.
- Furniture assigned to one room: Desks, mattresses, lamps, blackout curtains.
Shared house operating costs
These keep the whole property running and should be allocated thoughtfully across rooms.
Common examples:
- Utilities: Electric, water, gas
- Internet
- Common-area cleaning
- Consumables: Paper products, cleaning supplies, air filters
- Laundry support
- Lawn care or exterior upkeep
The allocation method matters. Some operators split equally by room. Others assign by room size, amenity level, or revenue share. What matters most is consistency. If you keep changing the method, trend analysis becomes unreliable.
Business and administrative costs
These sit above the physical house but still affect property performance.
Think about:
- Leasing and marketing
- Software subscriptions
- Bookkeeping
- Insurance
- Management time or management fees
Know what is operating expense and what is capital expense
This distinction is where many messy P&Ls go wrong.
A routine repair is usually an operating expense. Replacing a major system, upgrading a kitchen, or installing a house-wide improvement is typically a capital item. If you expense everything immediately, the month looks worse than the operation really performed. If you capitalize everyday repairs, the property looks artificially healthy.
According to Azibo's breakdown of rental property P&L metrics, Net Operating Income (NOI) is calculated as Effective Gross Income minus Operating Expenses, and operating expenses exclude financing costs like mortgage payments, taxes, and depreciation. The same source notes that landlords should conservatively reserve 1% of property value annually for maintenance capital expenditures, while the 50% rule should be treated only as a floor for conservative cost estimation, not a precise predictor.
The room-by-room operator who wins isn't always the one with the highest rent. It's usually the one who classifies costs correctly and sees weak spots early.
A generic landlord template rarely handles that well. Co-living houses need a P&L that tracks house-wide costs and room-level economics at the same time.
A Worked Example of a PadSplit-Style P&L
A simple example makes this easier than theory.
Let's use a fictional five-bedroom co-living house. The owner rents each room separately, pays the utilities, covers internet, hires a cleaner for common areas, and handles light maintenance. One room is the premium room with a private bath, so it rents for more than the others.
Sample Monthly P&L for a 5-Room Co-Living Property
| Line Item | Category | Amount |
|---|---|---|
| Room 1 rent | Income | $850 |
| Room 2 rent | Income | $800 |
| Room 3 rent | Income | $800 |
| Room 4 rent | Income | $775 |
| Room 5 rent | Income | $950 |
| Laundry income | Income | $60 |
| Late fees collected | Income | $40 |
| Total income | Income | $4,275 |
| Electricity | Shared expense | $290 |
| Water | Shared expense | $140 |
| Gas | Shared expense | $110 |
| Internet | Shared expense | $85 |
| Common-area cleaning | Shared expense | $180 |
| Supplies | Shared expense | $55 |
| Lawn care | Shared expense | $95 |
| Room turnover cleaning | Direct room expense | $120 |
| Minor room repair | Direct room expense | $85 |
| Marketing and listing cost | Administrative expense | $100 |
| Insurance allocation | Administrative expense | $150 |
| Bookkeeping software | Administrative expense | $35 |
| Total operating expenses | Expense | $1,445 |
| Net operating profit | Result | $2,830 |
What this example shows
First, the total income looks strong because the operator isn't relying on a single lease. The premium room lifts the top line, and small income streams like laundry and late fees add a bit more.
Second, the shared costs are manageable only because the house is occupied. If one room goes vacant, utilities won't fall much, but revenue will. That's why room-by-room operators need to watch vacancy at the room level instead of only looking at the property total.
Third, this monthly view still isn't the whole story. It doesn't include debt service, owner draws, or large capital items. It does show the house's operating performance clearly, which is the point of the P&L.
If you'd like another format to compare against, this P&L report example for rental operators is useful when you're building your own template.
How to make this usable in real life
Don't stop at one property-level table. Add a second tab or report that tracks each room with:
- Monthly billed rent
- Collected rent
- Occupied days
- Turn cost
- Repair cost
- Notes on issues or upgrades
That extra detail is what tells you whether Room 5 justifies its premium, whether Room 3 has too much turnover, or whether one room consistently drains staff time.
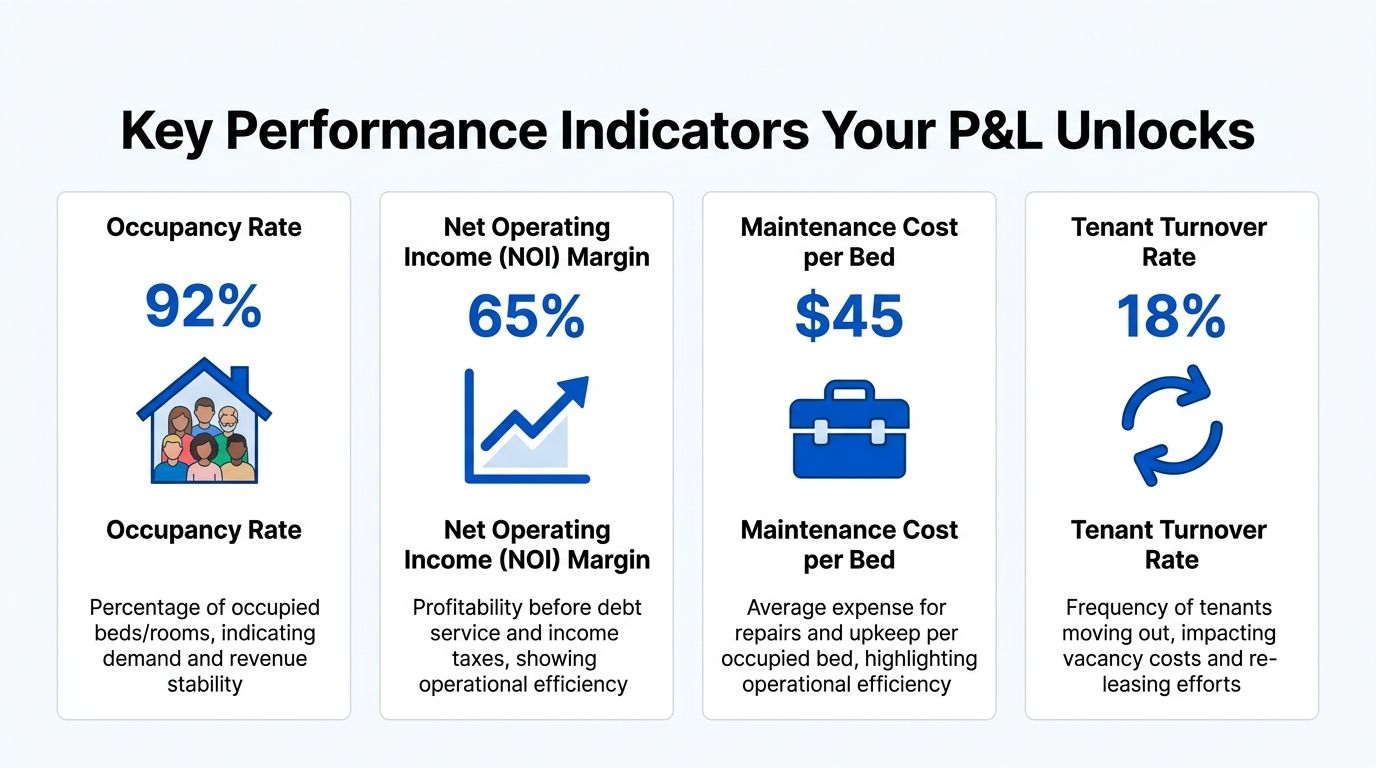
Key Performance Indicators Your P&L Unlocks
A clean P&L gives you more than a bottom-line number. It gives you metrics you can manage.
For co-living operators, I focus on a small set of indicators first. If those are clear, most other decisions get easier.
Net Operating Income
NOI is the core operating metric for a rental. It answers a simple question. How much did the property produce before debt service and major non-operating items?
Using the sample above:
- Effective gross income: $4,275
- Operating expenses: $1,445
- NOI: $2,830
That aligns with the standard formula already noted earlier. In practice, NOI tells you whether the house itself is healthy. If NOI is weak, better financing won't fix the operation.
NOI margin
NOI margin shows how much of each revenue dollar remains after operating expenses.
Using the sample above:
| KPI | Simple calculation | Result |
|---|---|---|
| NOI | $4,275 minus $1,445 | $2,830 |
| NOI margin | NOI divided by income | 66.2% |
| Net cash flow before owner taxes | Depends on debt and non-operating items | Varies |
| Gross rental yield | Annual rent divided by property cost | Requires purchase basis |
For this house, the NOI margin is 66.2%.
That doesn't mean every co-living property should hit the same figure. It means this example has room between revenue and operating cost. If your margin keeps shrinking, the P&L helps you identify whether utilities, cleaning, turnover, or pricing is responsible.
Operator check: A high-rent house can still be weak if shared expenses and turnover keep rising faster than room revenue.
Net cash flow
Many beginners confuse terms because net cash flow includes items your NOI excludes, especially mortgage payments and capital spending.
If the sample property has debt service, the cash left over after those payments may be much lower than the NOI suggests. That's normal. NOI measures operations. Cash flow measures what remains after financing and outflows.
For decision-making, use both. If NOI is healthy but cash flow is tight, financing or capital planning may be the issue.
Cap rate and gross rental yield
These metrics help when comparing investments, acquisitions, or repositioning projects.
- Cap rate uses annual NOI divided by property value or purchase basis.
- Gross rental yield uses annual gross rent divided by property value or purchase basis.
I haven't assigned a property value in the worked example, so I won't force fake precision. The point is practical. Once you know your annualized rent and annualized NOI, you can compare this house against another house, or against the same house before and after operational changes.
One KPI that room-by-room operators shouldn't ignore
Track performance by room, not only by house.
A property can show a decent total NOI while one room underperforms because of:
- repeated vacancy
- lower realized rent than expected
- higher wear and tear
- frequent complaint-driven maintenance
- a layout that attracts shorter stays
That room-level view is often the difference between generic bookkeeping and real management.
Turning P&L Insights Into Operational Action
The P&L matters only if it changes what you do next month.
A strong operator reads a report and turns it into pricing changes, maintenance decisions, amenity choices, and staffing adjustments. A weak operator files the report away and repeats the same mistakes.
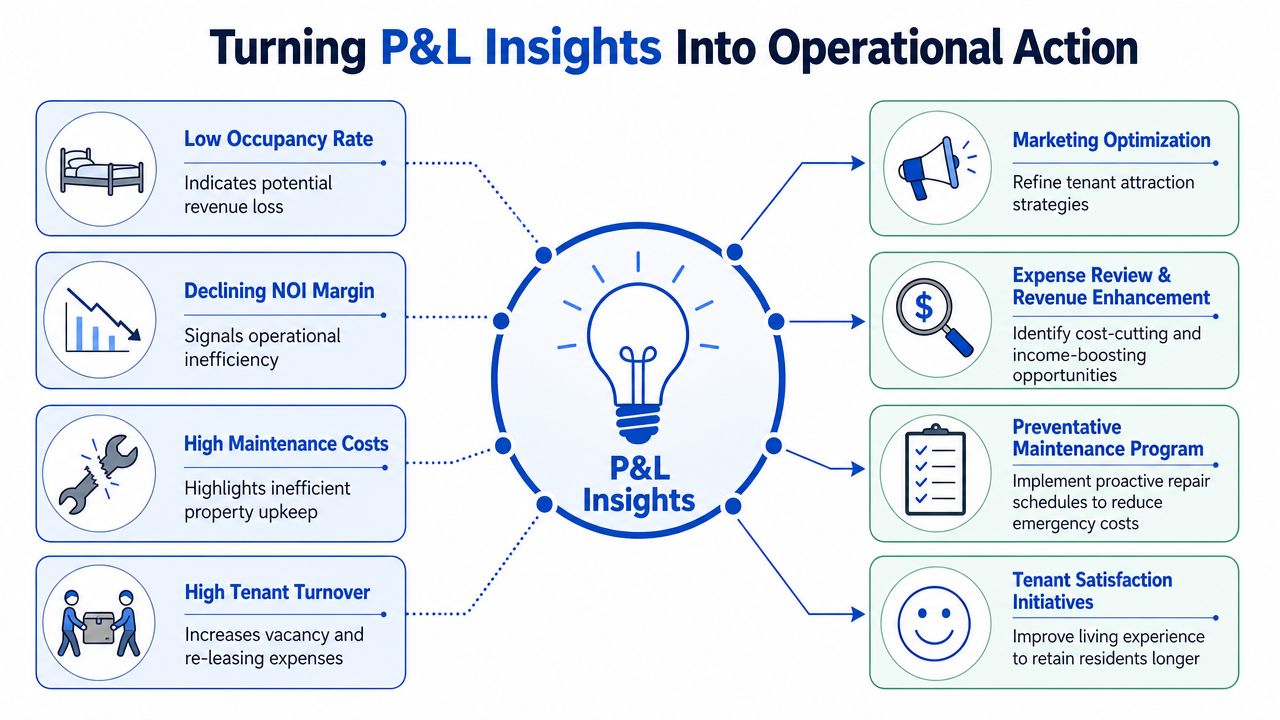
If occupancy is soft, fix pricing and leasing speed
A room that sits empty does more damage than most new hosts expect, because nearly every shared expense keeps running.
Historical rental market data discussed by DoorLoop's landlord market analysis shows that rent increased 31% between 2010 and 2022, including a 24% surge between 2021 and 2022. That same analysis says rent inflation outpaced average annual wage inflation, which is exactly why room-by-room operators need disciplined pricing instead of guessing.
If your P&L shows weak revenue, check these items first:
- Days vacant by room: One slow room may need a different price or better photos.
- Lead response time: Delayed replies often turn into missed move-ins.
- Move-in friction: Complicated screening or slow lock setup can kill conversions.
If utilities are heavy, look at house systems
In co-living, utility drag can wipe out the benefit of higher gross rent. The fix usually isn't one dramatic change. It's several small operational controls.
Useful moves include:
- Smart thermostats: Good for controlling common-area HVAC schedules and reducing waste.
- Leak checks and fixture review: Water overages often come from unnoticed problems.
- Room rules and education: Residents don't see the owner bill unless you make usage expectations clear.
Here's a practical walkthrough that complements the financial view:
If maintenance keeps spiking, separate noise from pattern
Not every ugly month means the house is failing. What matters is whether the same type of issue repeats.
Create a short review list each month:
Repeat repairs
Are you patching the same plumbing, lock, or appliance issue again?Turnover-linked work
Are costs rising because residents leave often, or because the unit standard is unclear?Capital warning signs
Are "repairs" really deferred replacements that belong in a separate capital plan?
A P&L should trigger a decision. Raise one room's price. Replace one failing device. Change one vendor. Tighten one process.
That is how financial reporting turns into NOI growth.
Common P&L Mistakes and Tax Considerations for Co-Living
Generic landlord advice often breaks down when you apply it to a house with multiple room agreements, shared utilities, frequent turnovers, and house-wide amenities.
The most common mistake isn't bad math. It's using a single-unit mindset for a room-by-room business.
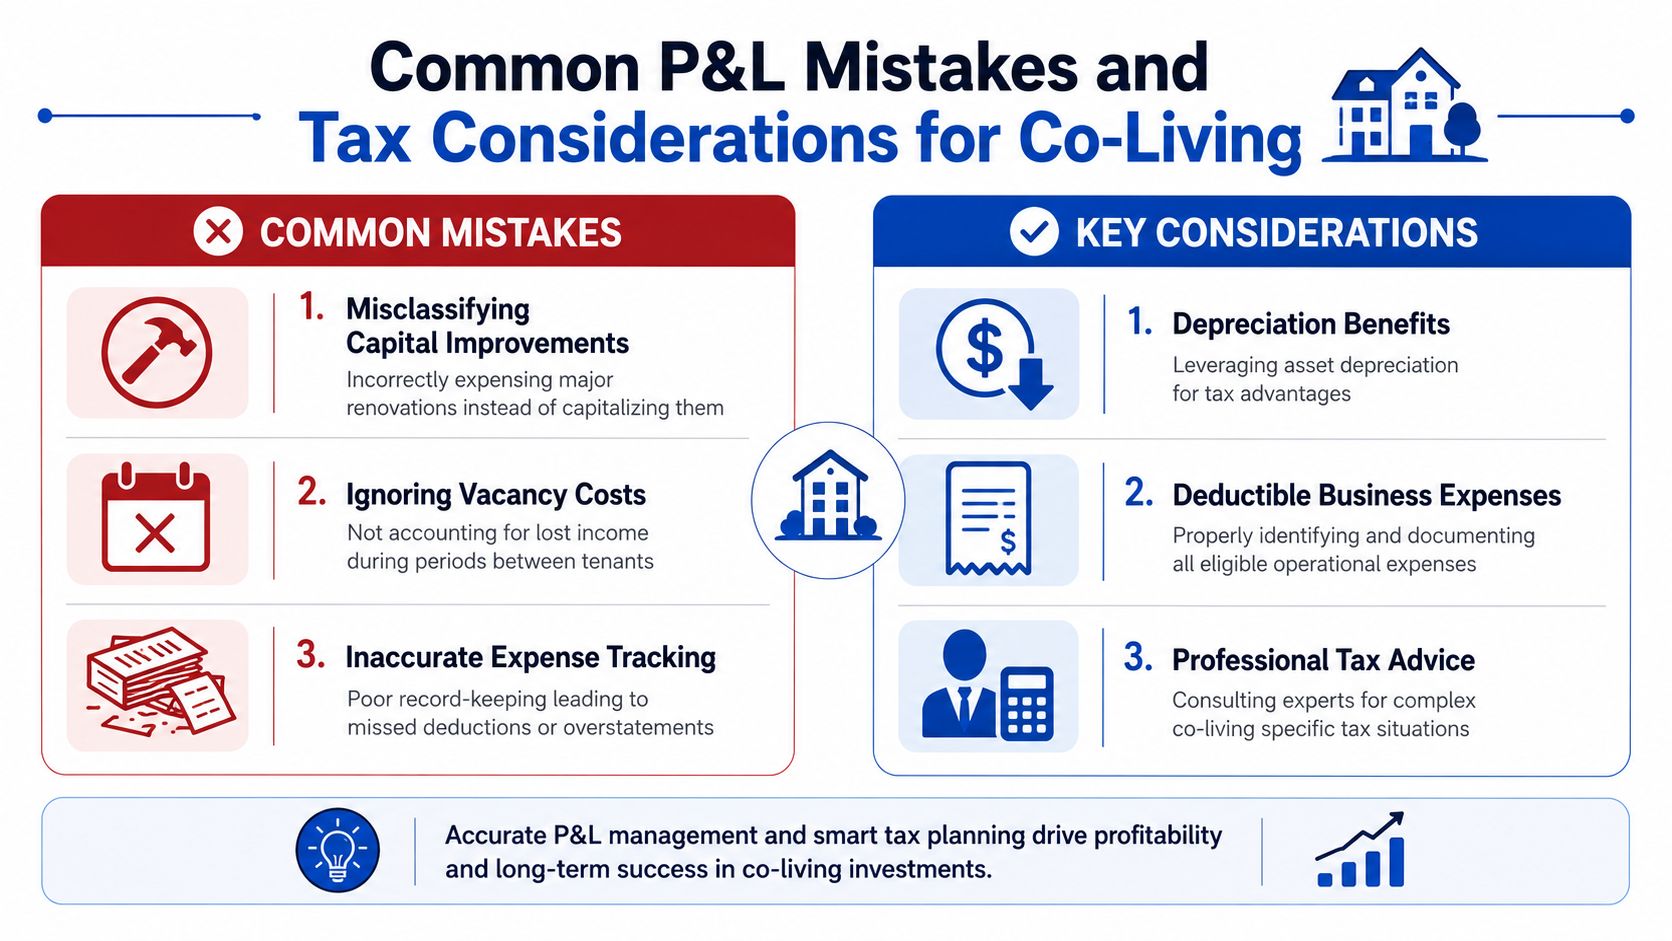
Mistakes that distort the real operating picture
A few problems show up constantly in co-living books:
- Shared costs never get allocated. Utilities, internet, and common-area supplies sit in one lump sum, so no one can tell which rooms are carrying their weight.
- Turnover gets buried. Cleaning, relisting, lock resets, and room prep disappear into general maintenance.
- Capital work gets expensed like routine repairs. That makes one month look terrible and hides the long-term asset plan.
- Vacancy gets treated casually. The house may look occupied enough, while one room underperforms for long stretches.
According to HomeRiver's discussion of rental property profit and loss, common guidance often fails to address co-living's specific accounting mechanics, especially how operators should allocate shared expenses and separate per-room performance from whole-property results. That's the exact gap that causes bad decisions.
The tax side gets murkier with co-living
Tax rules don't disappear because the property has multiple room tenants. But the reporting questions can get more confusing.
Anders CPA's explanation of active versus material participation rules states that the IRS defines active participation as owning at least 10% and having substantial management involvement, allowing up to a $25,000 loss deduction against non-passive income if MAGI is below $100k. That same discussion notes a phase-out range from $100k to $150k, and co-living operators often ask whether managing many room tenants changes how those rules apply in practice.
That uncertainty is real. A co-living house is one property, but it generates many tenant interactions. The paperwork may feel more like operating a small lodging business than holding a quiet single-family rental. That's exactly why the accounting has to be clean.
Suspended losses and real estate professional rules
If your allowable rental losses exceed the limit, or if your MAGI is above the threshold, losses can become suspended and carry forward. Madras Accountancy's explanation of passive activity loss carryovers notes that these carryovers are tracked on Form 8582 and can continue until you have passive income to offset them or dispose of the property in a fully taxable transaction.
Separate from that, The Tax Adviser on avoiding passive loss limitations explains that a taxpayer seeking real estate professional treatment must spend over 51% of working time and at least 751 hours annually in real estate businesses while materially participating. The same source notes that merely working over 500 hours without meeting that time-share threshold isn't enough.
Clean books don't just help operations. They give your CPA a defensible record of what was operating cost, what was capital, and how the property actually performed.
If you're trying to keep depreciation records organized across several houses, this guide to depreciation calculation software for rental portfolios can help you tighten the recordkeeping side.
Your Path to Financial Clarity and Higher Profits
Most hosts don't need a more complicated spreadsheet. They need a clearer operating system.
A solid profit and loss for rental property report tells you which room earns well, which expense category keeps drifting, and whether the house is delivering operating profit or just creating activity. Once that view is clean, decisions get simpler. You can price faster, cut waste sooner, and spot weak rooms before they become recurring problems.
Start small if you need to. Track income by room. Separate direct room costs from shared house costs. Keep capital items out of routine operating expenses. Review the report every month, even if the first version is rough.
The operators who build reliable NOI aren't always the ones with the nicest houses. They're the ones who keep financial visibility close to the day-to-day business.
PadPulse is building an all-in-one platform for PadSplit hosts and co-living operators who want cleaner reporting, faster leasing, and better NOI without juggling disconnected tools. If you want a simpler way to manage room-by-room pricing, communications, smart-home workflows, and P&L visibility, join the interest list at PadPulse.