Master Metric Property Management for Co-Living Success
July 20, 2026
You're looking at one empty room, one late payment, and a maintenance text that came in overnight. The house feels busy, but the numbers feel fuzzy. That's where many room-by-room operators get stuck. You know something needs attention, but you can't always tell which problem matters most right now.
That's why metric property management matters. It turns a pile of activity into a system you can interpret. Instead of asking, “Why does this property feel harder to run?” you start asking better questions. Which room type sits vacant longest? Which houses collect rent smoothly? Which maintenance issues keep repeating? Which pricing decisions are leaving money on the table?
For co-living and pad-by-room hosts, this matters even more than it does in traditional rentals. One house can have several separate revenue streams, separate move-ins, separate move-outs, and separate issues happening at the same time. Generic property management advice often focuses on unit-level occupancy and broad profit numbers. That misses the room-level detail that drives real performance in shared housing.
The need for professional, data-driven operations is only getting bigger. The global property management market reached $23.7 billion in 2024 and is projected to hit $57.57 billion by 2035, reflecting an 8.4% CAGR and underscoring growing demand for professional oversight at scale, according to property management industry statistics from Revenue Memo.
A simple way to think about it is this. Your property is like a small hotel mixed with a long-term rental business. If you only track total monthly rent, you're flying with one gauge on the dashboard. Good operators track occupancy, room revenue, collections, turnover speed, and maintenance patterns together.
Practical rule: If a metric helps you make a weekly decision, it belongs on your dashboard.
Introduction to Metric Property Management
A lot of hosts start with instinct. That's normal. You know which house feels stable, which member tends to pay late, and which room is hardest to fill. Instinct gets you started. Metrics help you scale.
Why room-by-room operators need a different lens
In a standard single-family rental, one vacancy often means the whole unit is empty. In co-living, one room can sit open while the rest of the home performs fine. That sounds safer, but it also creates a different management challenge. Small leaks in performance can hide for months.
For example, a full house can still underperform if:
- One premium room is priced too low and fills instantly every time
- One tenant segment pays less reliably than another
- Turnover tasks drag on after each move-out
- Maintenance spending stays scattered across repeated small issues
Metric property management becomes practical, not academic. It helps you decide whether to raise a room's rate, tighten screening, improve follow-up on unpaid balances, or fix the process behind slow turns.
What good metrics actually do
The best metrics don't just describe the past. They guide the next move.
A useful set of KPIs can help you:
- Reduce vacancy time by spotting pricing problems early
- Protect cash flow by tracking collection issues before they snowball
- Improve NOI by watching expenses that creep up room by room
- Save operator time by standardizing reporting and maintenance follow-up
Beginners sometimes worry that metrics will make management feel complicated. Usually the opposite happens. Once you define a few numbers clearly, decisions get calmer. You stop debating based on mood and start acting on patterns.
A vacant room is a pricing question, a marketing question, or a turnover question. Metrics help you figure out which one it is.
Understanding Core Property Management KPIs
The fastest way to understand KPIs is to treat them like the gauges in a car. One tells you speed. Another tells you fuel. A third warns you when the engine needs attention. You need more than one gauge because one number never tells the whole story.
Here's a visual way to organize the basics.
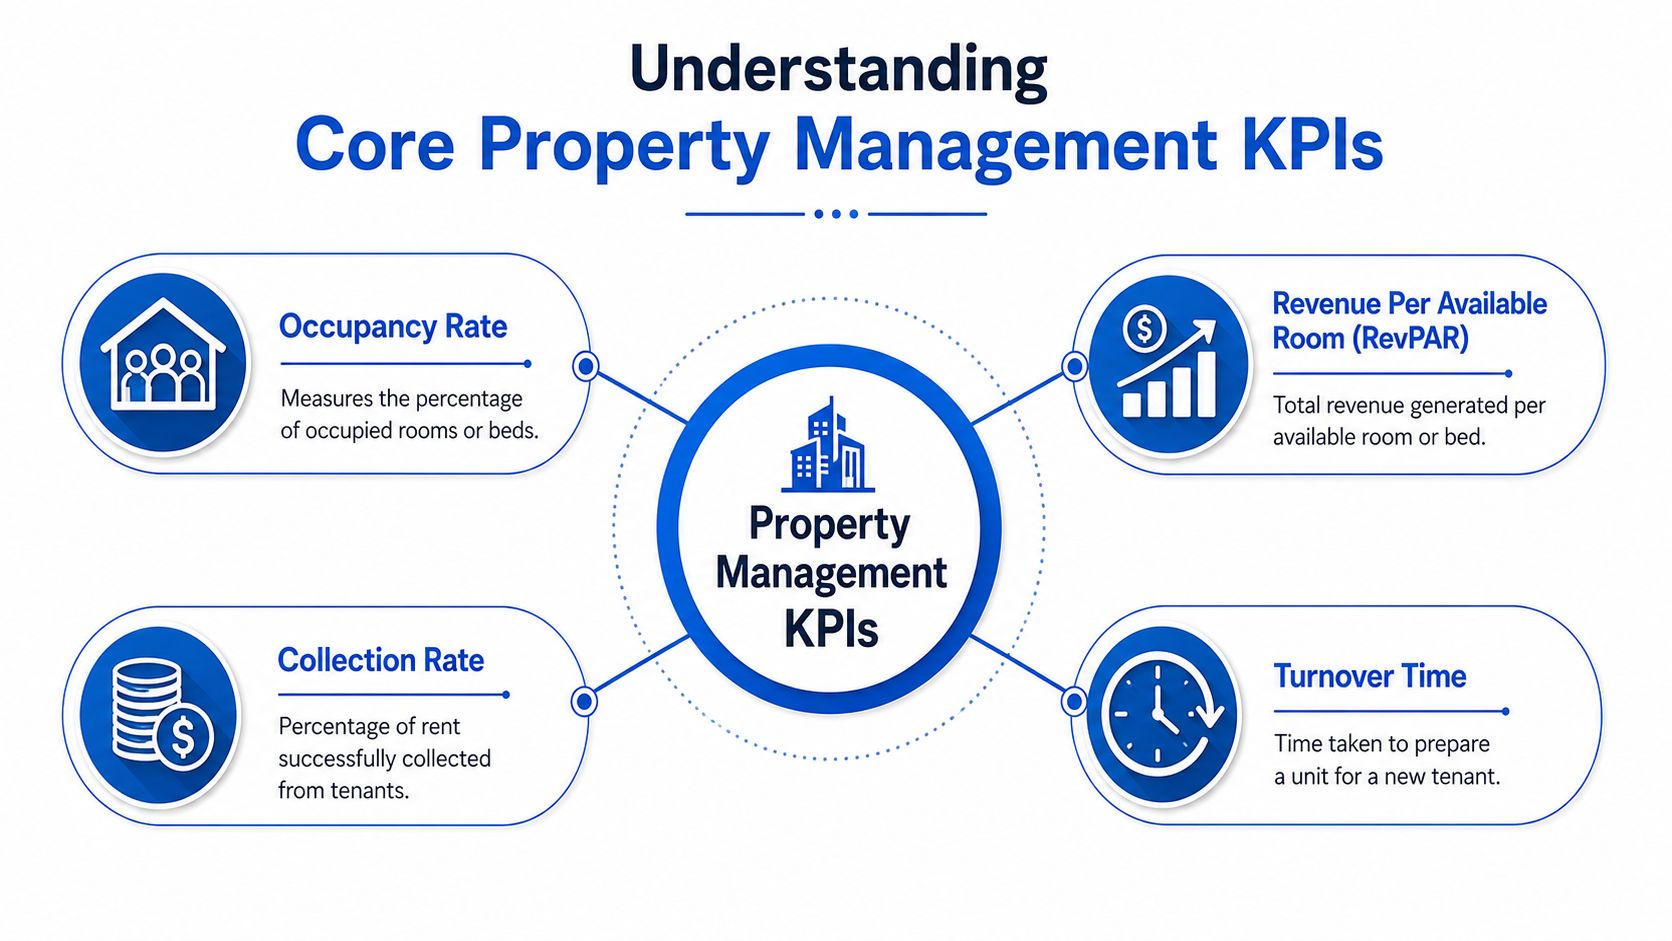
The four numbers most operators check first
Occupancy rate tells you how full your rooms or beds are. Consider seats on a flight as an analogy. Empty seats can't earn revenue once the plane leaves. Empty rooms work the same way.
Collection rate shows how much billed rent gets paid. High booked rent yields less than many hosts anticipate if tenants pay late or not in full.
RevPAR means revenue per available room. This is one of the most useful room-level metrics because it combines pricing and occupancy into one number. A room that's always occupied at the wrong price can still produce weak RevPAR.
Turnover time measures how long it takes to prepare a room for the next tenant. In room-by-room housing, slow turns drain income because they delay the next paying resident.
Urban rental markets target occupancy rates of 95-96%, and rates above that average can signal underpriced rooms and missed NOI opportunities in rent-by-room models, according to Buildium's property management KPI guide.
The supporting metrics that explain performance
The next layer helps explain why your top-line numbers look the way they do.
- NOI shows what the property earns after operating expenses.
- Maintenance cost per unit or room helps you spot homes with repeated service issues.
- CAC, or customer acquisition cost, shows what it costs to fill vacancies.
- LTV, or lifetime value, helps you think about how long a tenant stays and how much value that stay creates over time.
If occupancy is the headline, these are the footnotes that explain it.
For operators who want a broader framework for comparing houses and trends across multiple addresses, this guide on portfolio performance tracking for rental operators is a useful companion.
A short video can also help if you prefer visual learning.
How these KPIs connect
Many beginners track these metrics separately and then wonder why decisions still feel unclear. The trick is to read them together.
A quick example:
- Occupancy is high
- RevPAR is flat
- Turnover time is low
- NOI still feels weak
That pattern often points to pricing or expense control, not leasing speed.
Another example:
- Occupancy is dipping
- Collection rate is stable
- CAC is rising
- Turnover time is long
That often points to a refill problem after move-out, not a payment problem.
Calculating and Benchmarking Your Metrics
Some metrics sound intimidating until you write them as simple formulas. Once that's done, most operators can track them in a spreadsheet, a property management system, or even a weekly summary email.
Start with formulas you'll actually use
Use clear definitions and keep them consistent month after month.
Occupancy Rate
Occupied Rooms or Beds ÷ Total Available Rooms or BedsRevPAR
Total Room Revenue ÷ Available RoomsCollection Rate
Rent Collected ÷ Rent BilledTurnover Time
Time from move-out readiness to new move-in readinessNOI
Gross Operating Income minus Operating Expenses
If you want a beginner-friendly explanation of the income side of this equation, this overview of net operating income in rental housing helps connect the formula to day-to-day operations.Maintenance Cost per Room
Total Maintenance Spend ÷ Number of RoomsCAC
Total Sales & Marketing Budget divided by New Units Acquired, which gives co-living operators a clear measure of marketing efficiency, according to Atlas Global Advisors' guide to property management metricsLTV
There's no single universal formula for room-by-room housing because operators define value differently. Many hosts use total rent collected over a tenant's stay, adjusted by direct operating and turnover costs.
A simple benchmark table
Some metrics have hard benchmark data in the available research. Others are best judged against your own historical trend, your room type, and your submarket.
| KPI | Formula | Benchmark Range |
|---|---|---|
| Occupancy Rate | Occupied Rooms or Beds ÷ Total Available Rooms or Beds | Urban rental markets often target 95-96% |
| RevPAR | Total Room Revenue ÷ Available Rooms | Compare by room type, house, and month |
| Collection Rate | Rent Collected ÷ Rent Billed | Higher and more consistent is healthier |
| Turnover Time | Time from move-out readiness to new move-in readiness | Shorter is better if room quality stays high |
| NOI | Gross Operating Income minus Operating Expenses | Track trend by house and month |
| Maintenance Cost per Room | Total Maintenance Spend ÷ Number of Rooms | Compare against your own history |
| CAC | Total Sales & Marketing Budget ÷ New Units Acquired | Lower is better if lead quality stays strong |
| LTV | Tenant value over full stay | Higher is better when paired with reliable collections |
Where beginners usually get confused
The most common mistake is mixing unit-level and room-level data. If you rent by the room, your metrics should usually start at the room level. A house may look healthy at the property level while one room type consistently underperforms.
Another common mistake is tracking raw totals instead of ratios. Total rent collected matters, but collection rate tells you more. Total marketing spend matters, but CAC tells you whether that spend is efficient.
Don't compare a large house and a small house using raw dollars alone. Ratios make properties comparable.
How to benchmark when you don't have a published range
Not every metric comes with a published target. That's okay. You can still benchmark in a useful way.
Try this approach:
- Compare against your own last three months to spot direction.
- Compare similar rooms together rather than mixing all rooms.
- Separate houses by tenant type if your portfolio includes different audiences.
- Flag outliers first, because outliers usually deserve attention faster than averages.
For room-by-room operators, benchmarks work best when they answer a practical question. Is this room underpriced? Is this house expensive to maintain? Is this marketing channel worth the cost? A metric only earns its place if it helps you decide.
Setting Reporting Cadence and Dashboard Templates
Good metrics lose value when you only check them after a bad month. Reporting cadence solves that. It creates a rhythm, so you're not relying on memory or waiting for a problem to become obvious.
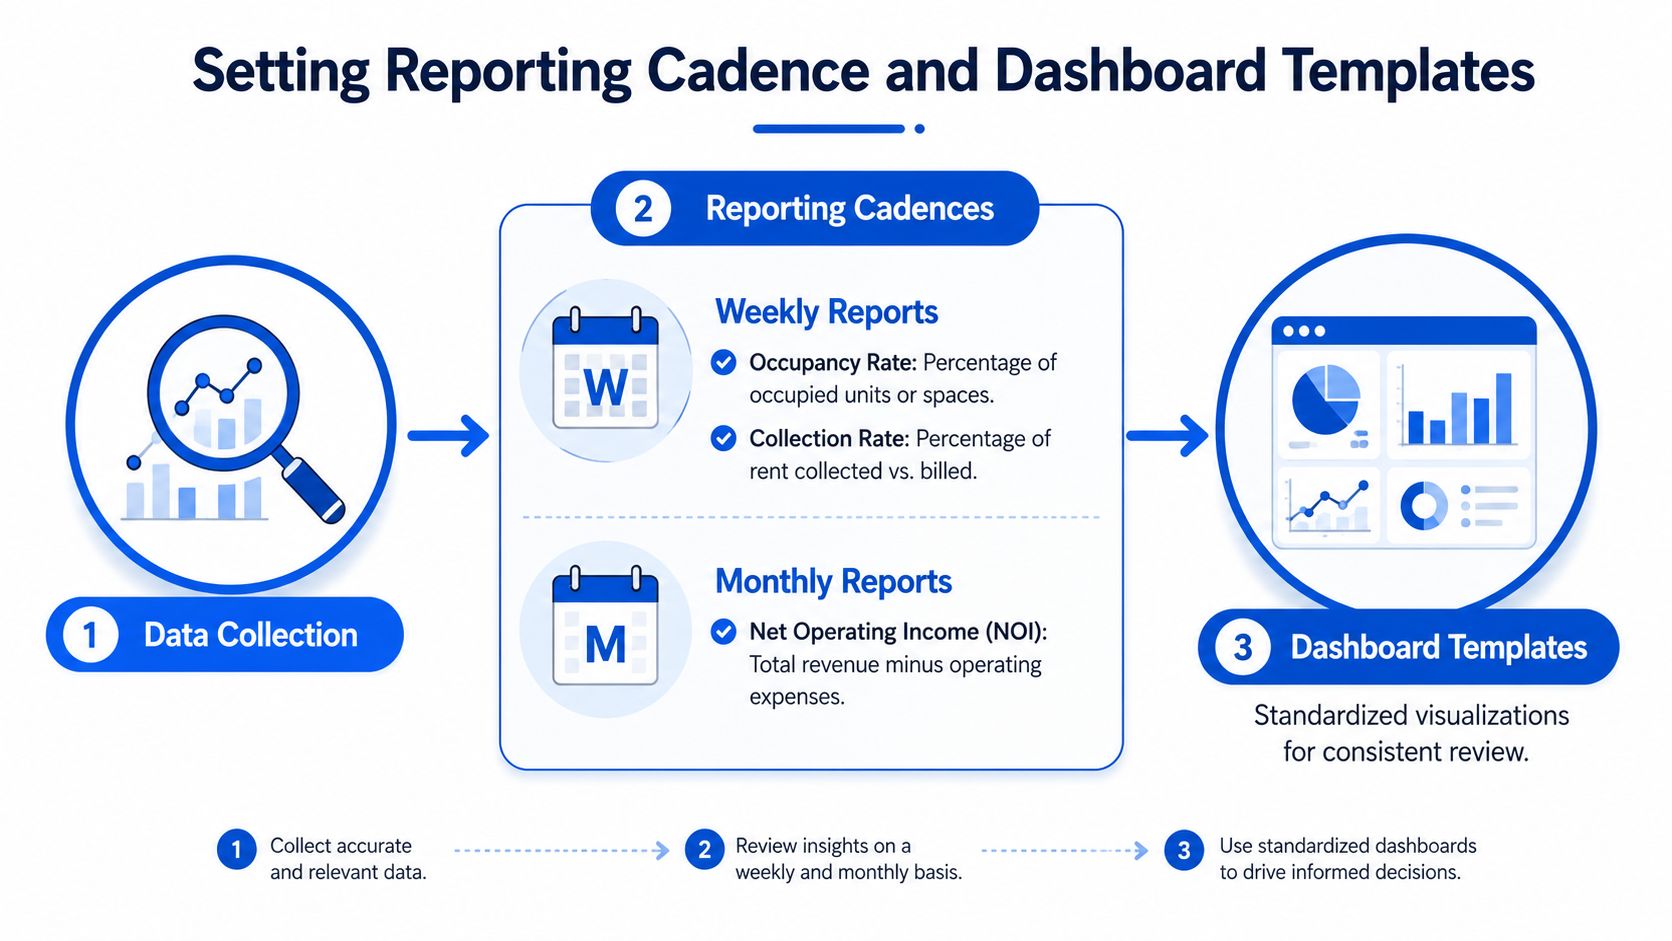
Match the metric to the decision speed
Some numbers deserve weekly attention because they change quickly. Others are more useful monthly or quarterly.
A practical cadence looks like this:
Weekly reviews
- Occupancy rate to catch open rooms fast
- Collection rate to spot payment friction early
- Turnover pipeline to see which rooms are move-in ready and which are stalled
Monthly reviews
- NOI to understand actual operating performance
- Maintenance cost patterns to see whether one house is becoming expensive
- RevPAR by room type to catch pricing gaps
Quarterly reviews
- CAC
- LTV
- Channel performance
- Tenant segment patterns
This doesn't have to be fancy. A spreadsheet reviewed every Monday beats a dashboard nobody opens.
What to put on a dashboard
A beginner-friendly dashboard should answer three questions within a minute:
- Are rooms filled?
- Is rent being collected?
- Are operations staying efficient?
That means your dashboard should usually include:
- Occupancy trend
- Current vacancies
- Collection summary
- RevPAR by room
- Open maintenance items
- Turnover status
- Monthly NOI snapshot
A dashboard becomes much more useful when the layout stays consistent. If the same widget moves every week, you spend time searching instead of reviewing.
For operators building repeatable reporting processes, these financial reporting templates for rental operations can help structure the review.
Review fast-moving metrics often enough to act on them. Review slower financial metrics often enough to manage them.
A simple template layout
Think in layers.
Top row should show headline KPIs. Use occupancy, collections, RevPAR, and NOI.
Middle row should show movement. Trend lines, not just snapshots, help you see whether the property is improving or slipping.
Bottom row should show action items. Which rooms need repricing? Which turns are delayed? Which balances need follow-up?
Hosts often overbuild dashboards. They add too many charts and stop trusting any of them. A lean dashboard is usually stronger because each box has a purpose.
Strategies to Improve Key Metrics
A room goes vacant on Friday. By Monday, the host has dropped the price, but the underlying problem was slower reply time, weak photos, or a two-day delay before the room was even ready to show.
That is how good operators lose margin. They react to the number they can see instead of the cause behind it.
Improve occupancy with room-level diagnosis
Occupancy improves faster when you inspect the room like a guest would.
Start with the room itself. A bright room with a private bath, desk space, and low hallway noise should not be judged the same way as a smaller room near the kitchen. Pad-by-room housing works at the bedroom level, so your fix should start there too.
A useful order is:
- Review whether the room price matches its features
- Check listing photos, title clarity, and how quickly inquiries get a reply
- Measure the gap between move-out, turn completion, and relisting
- Compare similar rooms, not just the property average
High occupancy can also hide a problem. If one room type stays full every month while another lags, you may have a pricing mismatch, not a demand problem.
Raise RevPAR by pricing rooms like distinct products
RevPAR improves when each room earns close to what that specific room can support.
In a pad-by-room house, bedrooms are closer to seats on an airplane than units in a duplex. Window light, bathroom access, floor level, storage, and noise all change what a renter will pay. Flat pricing ignores those differences and usually leaves money on the table.
A room with:
- better natural light
- private bath access
- quieter placement in the house
- stronger appeal to a specific tenant profile
can justify a different price than another room in the same property.
Research on underserved co-living metrics argues that generic property management guidance often misses room-level dynamic pricing and room-level demand analysis, according to The Fractional Analyst's write-up on underserved CRE metric segments.
Improve collections and turnover with repeatable systems
Collections and turnover usually improve through consistency.
Late rent follow-up should follow the same script and timing every time. Turn tasks should start before a room is officially vacant when notice has already been given. That removes idle days, which matter a lot in room-by-room operations because one delayed clean can hold up one full income stream.
Useful systems include:
- Automated rent reminders before due dates
- Standard late-payment follow-up with the same message flow each time
- Move-out checklists for cleaning, inspection, and repair handoffs
- Pre-scheduled turn tasks tied to expected vacancy dates
These habits are simple. They also protect revenue.
Reduce expense drag by watching OER closely
For shared housing, Operating Expense Ratio, or OER, is a practical measure of efficiency. The formula is Operating Expenses ÷ Gross Operating Income × 100. NetSuite's overview of real estate metrics places a common target range for well-run shared housing portfolios at 35% to 45%, with traditional single-tenant rentals often closer to 40% to 50%, according to NetSuite's overview of real estate metrics.
This matters for pad-by-room hosts because small costs stack up quickly. Utility waste in one month, extra cleaning calls in the next, and repeated minor repairs can slowly shrink NOI even when rooms stay occupied.
A full house can still be a weak performer if the house costs too much to run.
Treat maintenance as a savings metric
Maintenance affects speed, resident trust, renewals, and expenses at the same time.
Cove's guide to property management KPIs recommends responding to urgent repairs within 24 hours and completing 90% of routine maintenance requests within 3 days, according to Cove's guide to property management KPIs.
That framework is especially useful in co-living. One lock failure, leak, or HVAC issue can disrupt several residents at once. In a single-family rental, one repair affects one household. In a pad-by-room setup, the same repair can damage reviews, increase complaints, and slow leasing for multiple rooms.
A stronger maintenance process often includes:
- Urgency categories so the team knows what moves first
- Photo-based issue logging to reduce clarification messages
- Recurring issue tags to spot repeat failures
- IoT monitoring for HVAC, leaks, and smart access devices
IoT tools help most when you connect them to costs. A smart thermostat alert that catches abnormal runtime is not just a maintenance event. It can prevent wasted utility spend, avoid a resident complaint, and reduce the chance of a larger repair later. For pad-by-room hosts, that is one of the clearest places where modern operations can improve NOI.
Showdigs also points to growing interest in KPI frameworks that track smart HVAC energy costs, predictive maintenance savings, and room-level market intelligence for newer rental operations, according to Showdigs' property management metrics discussion.
Lower CAC by segmenting your leasing effort
Customer acquisition cost gets more useful when you stop treating every lead as the same kind of lead.
Students, early-career professionals, workforce housing applicants, and shorter-stay renters often respond to different channels, timelines, and price points. If you group all of them together, your CAC number becomes too broad to guide action.
Track CAC by segment and then compare it against fill speed, payment reliability, and length of stay. That helps you spend more on the audience that fits your rooms best, not just the audience that generates the most inquiries.
Pad-by-Room Case Study Examples
Examples make the numbers easier to trust because you can see what changed and why.
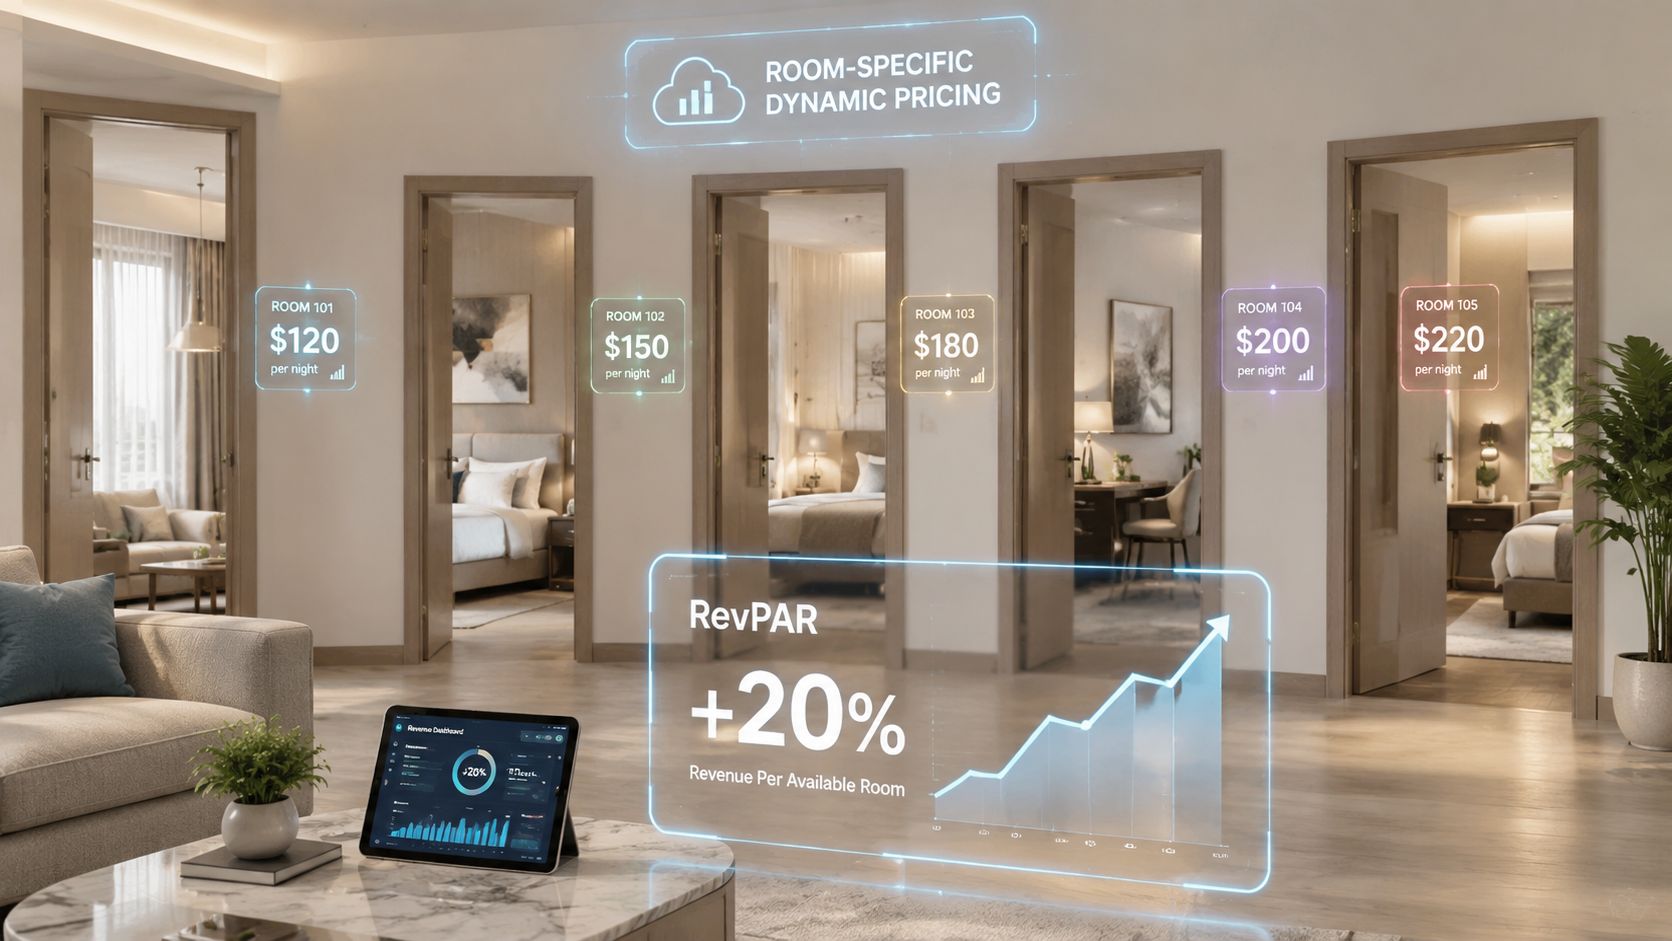
Example one with room-specific pricing
A five-room house had a familiar pattern. Two rooms filled quickly every cycle, one room lagged, and one premium room never stayed vacant long. On the surface, the house looked stable because overall occupancy stayed strong.
The host stopped treating all rooms as equal and reviewed each room by:
- privacy
- natural light
- bathroom access
- noise level
- likely tenant appeal
That changed the pricing conversation. Instead of one average room rate, the host built room-specific pricing rules and watched RevPAR by room, not just by house.
The result was a 20% improvement in RevPAR. That outcome works as a practical example of why room-level dynamic pricing matters in pad-by-room housing. The point isn't that every house will produce the same lift. The point is that room-specific pricing often reveals value that property-level averages hide.
Example two with smart-home turnover improvements
A student-focused co-living operator had another common issue. The leasing team could fill rooms, but move-ins and move-outs were taking too much staff time. Keys had to be handed off manually. Thermostat issues triggered repeated calls. Basic coordination slowed everything down.
The operator added smart-home workflows with keyless access and better check-in and check-out processes.
Industry data shows co-living properties can reduce average check-in and check-out processing time from 45 minutes to under 10 minutes with smart-home integrations, enabling a 15–20% improvement in annual RevPAR, according to Proprli's guide to technical real estate management KPIs.
That kind of improvement makes sense operationally. Faster turns mean rooms become available sooner. Staff spend less time on repetitive handoffs. Tenants get a smoother arrival experience. Revenue improves because friction drops.
What these examples teach
Both examples point to the same lesson. Broad property metrics are useful, but room-level metrics create better decisions.
One operator improved pricing by reading each room as its own product. Another improved turnover by treating access and check-in as measurable processes.
The most profitable room-by-room operators don't just collect data. They connect each metric to one repeatable action.
Conclusion and Next Steps
Metric property management works best when it stays simple enough to use and specific enough to guide action. For room-by-room operators, that usually means focusing on room-level occupancy, RevPAR, collections, turnover speed, expense control, and maintenance response.
The big shift is mental as much as financial. You stop running the portfolio by feel alone. You start reading patterns. One room might need a pricing change. One house might need tighter maintenance workflows. One tenant segment might be costing more to acquire than it returns over time.
If you're getting started, don't build a giant reporting system on day one. Start with a small weekly scorecard. Track occupancy, collections, current vacancies, active turns, and one expense view. Then review it on the same day every week.
That habit is what turns data into better operations.
If you want a simpler way to manage rent-by-the-room operations, PadPulse is building an all-in-one platform for PadSplit hosts and co-living operators. It's designed to centralize pricing, communications, smart-home workflows, and financial visibility so you can save time, fill vacancies faster, and improve NOI. You can join the interest list for beta updates and early access opportunities with no billing before launch.