Market Trend Analysis for PadSplit Hosts to Boost NOI
September 5, 2026
You've got two houses in nearby ZIP codes, yet one is filling steadily while the other is carrying empty rooms. The properties look similar on paper, so you lower the slower house's price, boost the listing, and hope demand returns. A week later, you still don't know whether the problem was price, seasonality, a new competitor, weak listing visibility, or a local demand shift.
That uncertainty is exactly where market trend analysis earns its place. For room-by-room operators, the useful question isn't whether the national rental market is rising or falling. It's whether demand for a specific room type, price band, and submarket is strengthening, weakening, or moving through a normal seasonal pattern.
Why Market Trend Analysis Matters for Room by Room Rentals
A host can make the wrong decision with perfectly reasonable information. Suppose House A sits near a major employment corridor and House B is only a short drive away near a different bus route. House A keeps receiving inquiries, while House B loses occupancy. A national rent report may show stable demand, but that average won't explain the difference between the two houses.
The first operator might raise prices carefully because demand is holding. The second might need better photos, a different lead response process, a shorter minimum stay, or a price adjustment. Without local market trend analysis, both operators may react to the same broad headline and miss what's happening at house level.
Separate durable movement from short-term noise
A single vacant room doesn't prove that demand has weakened. The room may have been listed late, priced above nearby alternatives, or shown with unclear house rules. Likewise, one strong week doesn't prove that the submarket can support a higher rate.
A durable signal usually has several supporting clues:
- Repeated direction: Inquiries, new listings, occupancy, or comparable rents move in the same direction across multiple review periods.
- Local consistency: Similar properties in the same submarket show a related pattern.
- Operational relevance: The change affects a decision such as price, marketing channel, lease length, or vacancy timing.
- A testable explanation: You can state what would prove the signal wrong.
That last point matters. If you believe a new employer opening is lifting demand, write down the evidence you'd expect to see, such as more inquiries from that area, faster room turnover, or stronger conversion at the same price. If those indicators don't appear, don't keep defending the story.

Use a hierarchy, not one dashboard
Start with the broad economic backdrop, then narrow the view:
- Macro: Employment conditions, interest-rate regimes, inflation, and broad housing pressure.
- Market: The city or metro area where your houses operate.
- Submarket: The ZIP code, transit corridor, or neighborhood.
- House: Room type, amenities, price, vacancy, and lead quality.
Long-horizon data helps analysts classify broad regimes rather than treating every price move as meaningful. One independent market-history study assembled 100 years of daily data across stocks, bonds, commodities, inflation, and rates, defining a bear market as a decline of at least 20% from a prior high and a bull market as the recovery from the bottom to the next peak. That framework, described in the historical study of market cycles, shows why consistent thresholds and long time series matter.
You don't need a century of data to manage rooms. You do need consistent definitions, comparable periods, and a habit of checking whether local evidence supports the broader story. For a useful primer on understanding supply and demand shifts, focus on how changes in available inventory and buyer or renter interest interact.
The core takeaway is simple: macro conditions set the context, but local signals drive NOI decisions. A room operator wins by identifying which nearby demand changes deserve action before applying a broad market conclusion to every house.
What Market Trend Analysis Really Means Without the Jargon
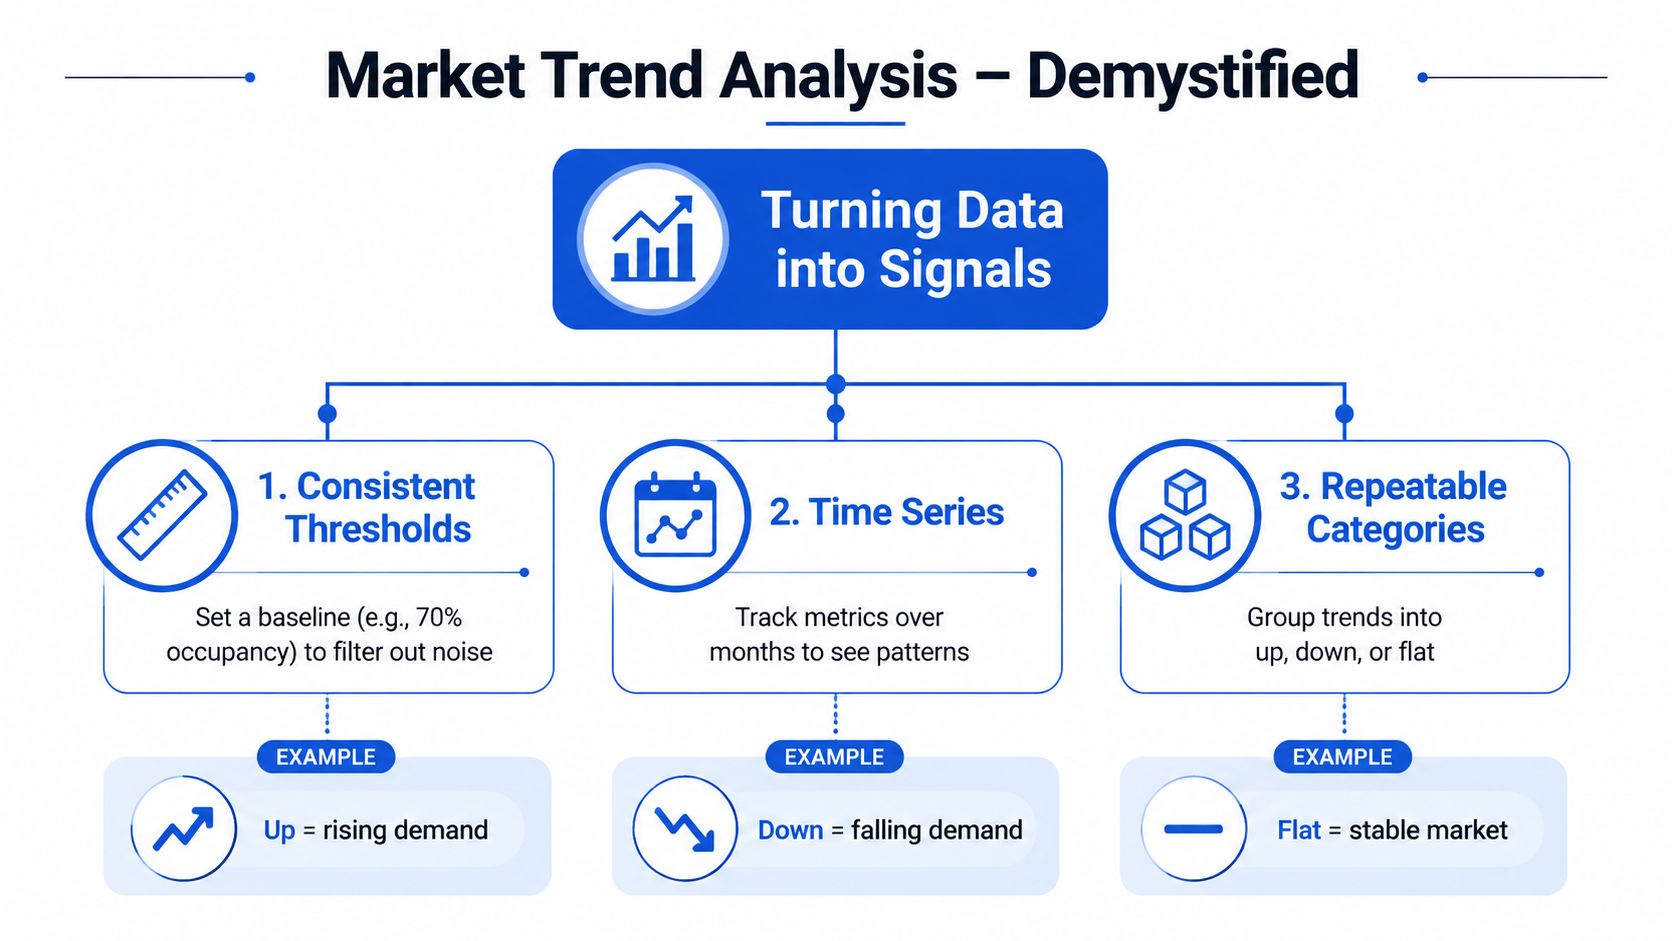
Market trend analysis is the practice of turning repeated observations into a decision signal. You collect comparable information over time, apply consistent definitions, and classify the direction as rising, falling, or stable.
That definition sounds technical, but the daily work is practical. You might track how many comparable rooms are available, how quickly inquiries arrive, whether advertised rents change, and how long your own rooms remain vacant. The value comes from comparing like with like.
Build a repeatable signal
Use this sequence for a beginner-friendly analysis:
- Choose the decision: Are you deciding whether to change price, improve marketing, adjust lease terms, or hold steady?
- Define the comparison: Compare the same room type, submarket, and time period whenever possible.
- Set a threshold: Decide what movement would count as meaningful before looking at the result.
- Classify the direction: Label the signal as up, down, or flat.
- Record the outcome: Check later whether the decision improved occupancy, revenue, or vacancy speed.
A threshold isn't a magical universal number. It's a rule that stops you from reacting to every small fluctuation. For example, you might require a clear change in inquiry quality and comparable availability before altering a room's price.
Durable trends versus noise
Noise is a short-lived movement that doesn't survive comparison. A durable trend keeps appearing after you control for obvious differences such as listing quality, room features, holidays, and move-in timing.
Ask four questions:
- Did the change appear in more than one observation period?
- Did comparable rooms show a similar direction?
- Can an operational event explain it, such as a renovation or listing delay?
- What evidence would make you reverse your conclusion?
Forecasting guidance warns that higher in-sample accuracy doesn't guarantee better business performance. Overfitting, data leakage, and spurious correlation can make a model look convincing while it performs poorly on future observations, so holdout periods and regular refreshes matter. The practical discussion in this market trend analysis methodology guide is useful when you're tempted to trust a neat historical pattern too quickly.
Practical rule: Don't ask whether the data confirms your idea. Ask what result would disprove it.
For readers who want a broader technology view, the WebscrapingHQ 2026 guide offers additional context on collecting and organizing market information. For room operators, the principle remains the same: clean inputs, consistent comparisons, and decisions that someone can explain later. A market intelligence platform can support that process, but it shouldn't replace judgment about what the numbers represent.
Key Metrics Data Sources and How to Keep Them Clean
A room operator doesn't need every available data point. The strongest operating set usually combines comparable room rents, days on market, inquiry volume, occupancy, and new supply.
Comparable rents tell you what nearby operators are asking, not necessarily what they're collecting. Days on market shows how quickly a room moves from listing to commitment. Inquiry volume indicates attention, while lead quality and conversion reveal whether that attention is useful. Occupancy by submarket helps you compare houses without letting a strong property hide a weak one.
Build a small, reliable evidence set
Use consistent sources and record the date you observed them. Listing marketplaces can show advertised room rates, amenities, and availability. Your own property-management records should provide inquiries, response times, move-ins, move-outs, vacancy days, and occupancy. Local housing or planning sources may reveal additions to nearby supply, while competitor reviews and listing changes can explain why a room suddenly looks less attractive.
| Metric to Track | Reliable Source Example | Review Cadence |
|---|---|---|
| Comparable room rents | Live listings for similar rooms in the same submarket | Weekly |
| Days on market | Your listing history and observed competitor availability | Weekly |
| Inquiry volume | Inquiry inbox, call log, and message records | Weekly |
| Occupancy by submarket | Internal occupancy records grouped by ZIP code or neighborhood | Weekly and monthly |
| New supply additions | New comparable listings, property announcements, and local planning information | Monthly |
The cadence should match the decision. Competitive prices and new listings can change quickly, so weekly checks are useful. Deeper occupancy, retention, and submarket comparisons need a monthly view.
Clean the data before interpreting it
A practical workflow looks like this:
- Define the objective. Decide whether you're analyzing price, occupancy, lead quality, retention, or supply.
- Collect only relevant records. Remove fields that don't support the decision.
- Clean the inputs. Resolve duplicates, missing values, inconsistent room labels, and mismatched units.
- Transform the records. Put dates, prices, room types, and locations into comparable formats.
- Integrate sources. Match your internal vacancy records with comparable listing observations.
- Validate the result. Check totals, dates, and unusual changes against the original records.
- Detect outliers. Investigate a sudden rent jump or inquiry collapse before treating it as a trend.
This sequence reflects the workflow recommended in trend-analysis guidance from Appinio. The same guidance highlights process and data problems as major sources of model failure, alongside unsound methods, untrained forecasters, and politically biased inputs.
Keep an audit trail
Create a simple change log. Record when you changed a room's price, why you changed it, what evidence supported the move, and which result would cause you to reverse it.
Human overrides deserve documentation too. A host may know that a house is temporarily under renovation or that a competing listing has misleading photos. That local knowledge is valuable, but it should be marked as an assumption rather than mixed into the data.
The goal isn't elaborate software. It's traceability. If a number changes, you should know whether the market moved, the source changed, or someone entered the record differently. For a deeper look at local market intelligence, focus on how submarket-level context improves decisions that broad averages can't support.
How to Spot Seasonality Cohorts and Supply Demand Shifts
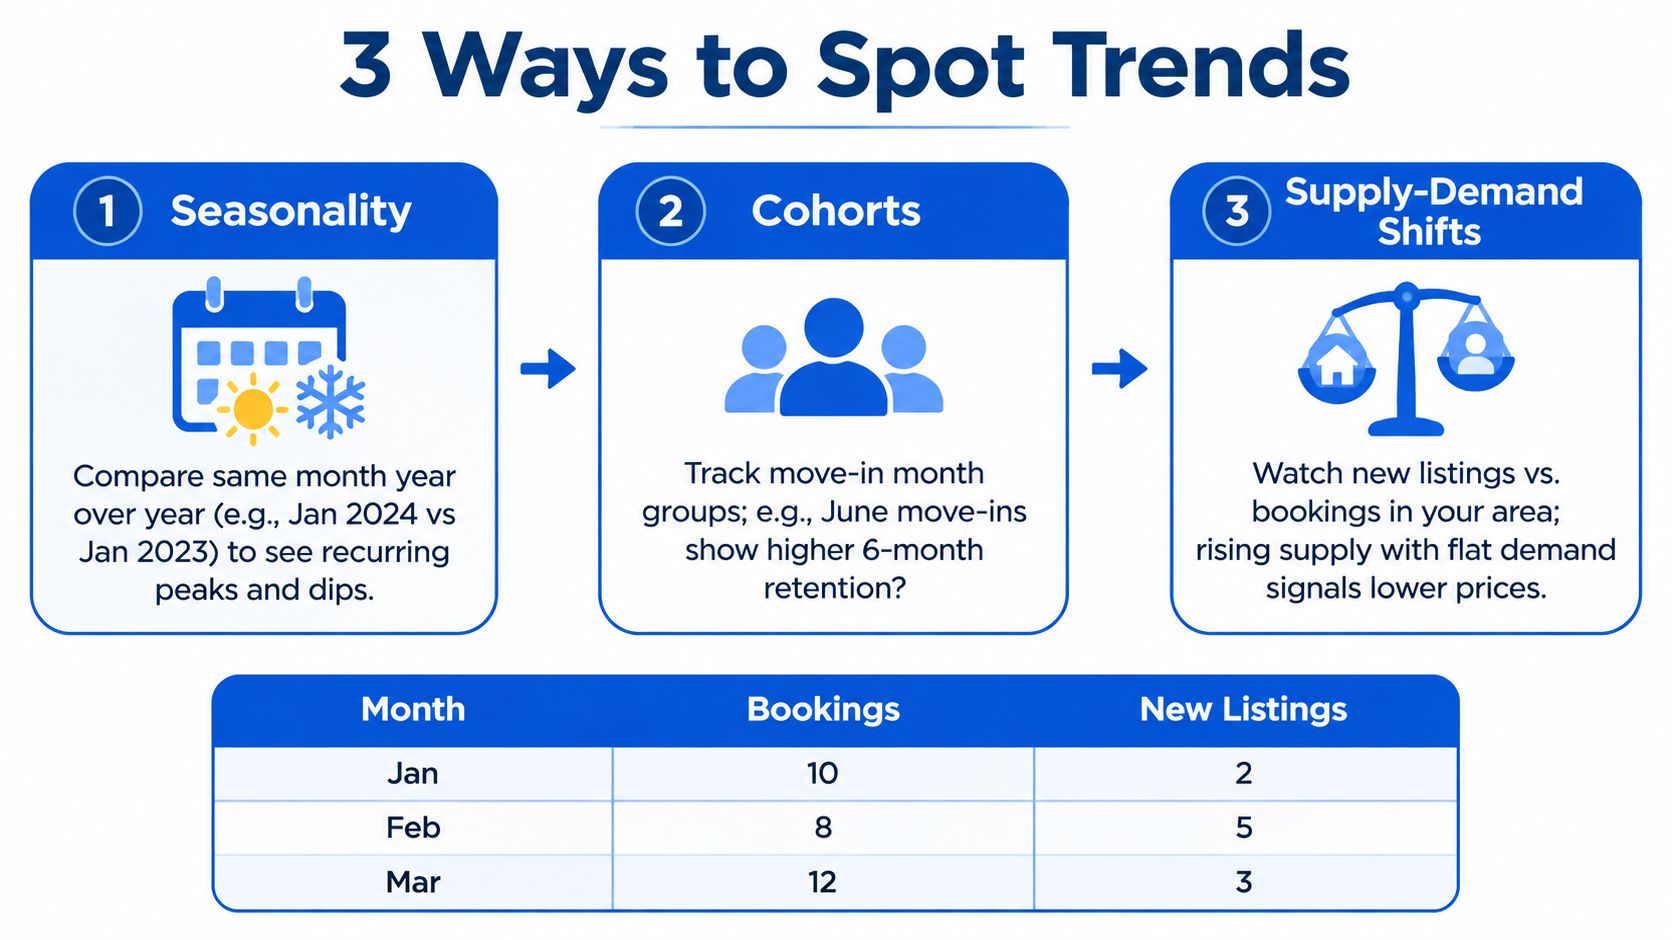
Three techniques give room operators a clearer read than a single occupancy figure: seasonality checks, cohort analysis, and supply-demand mapping. Each answers a different question.
Seasonality asks whether a pattern repeats at the same time of year. Cohorts ask whether people who moved in during the same period behave similarly. Supply-demand analysis asks whether available rooms are growing faster than renter interest.
Check seasonality by matching periods
Compare the same month or equivalent period across years, using the same submarket and room category. If occupancy falls during a particular period but the same decline appears repeatedly, the movement may be seasonal rather than a pricing failure.
A simple template:
- Record occupancy for the selected period.
- Record comparable rents and available listings.
- Note inquiry volume and lead quality.
- Compare the same period from the previous year.
- Separate recurring movement from unusual events.
Don't compare a high-demand period with a low-demand period and call the difference a trend. Also note changes in your own inventory. A house renovation, room conversion, or listing pause can distort the comparison.
Use cohorts to understand retention
A cohort is a group that shares a starting point, such as move-in month. Grouping residents this way helps you see whether different arrival periods produce different retention or pricing outcomes.
For example, compare residents who moved in during one month with those who moved in during another. Track how long they stay, whether they renew, how much support they require, and whether the original price attracted a stable fit. You're not trying to prove that the move-in month caused the result. You're looking for a useful operating clue.
A cohort worksheet can include:
- Move-in period
- Original room price
- Lead source
- Length of stay
- Move-out reason
- Replacement time
- Price at the next move-in
Cohorts also protect you from mixing different customer groups. A room filled through an urgent, price-sensitive campaign may behave differently from one filled through an employer referral. If you combine both groups, the average can hide the reason retention changed.
Map supply against demand
Create a monthly list of comparable new listings and compare it with your inquiry and booking records. Rising listings with flat inquiries can indicate that renters have more choice. Falling listings with steady inquiries may suggest stronger pricing power, though you still need to check room quality and location.
Use a small table like this:
| Month | Bookings | New Listings |
|---|---|---|
| Jan | 10 | 2 |
| Feb | 8 | 5 |
| Mar | 12 | 3 |
The table doesn't tell you what to do by itself. February's lower bookings and higher new supply could justify a closer review of price, photos, response speed, and availability. March's stronger bookings may reflect a real improvement, or it may follow a marketing change. Check the operational record before calling it a market shift.
Keep the calculations simple
For an occupancy trend, compare occupied room-nights with available room-nights for the same period. If occupied room-nights rise while available capacity stays comparable, occupancy is moving up. If available capacity changes, interpret the result carefully.
For a rent trend, compare the current advertised rent with the earlier comparable rent, while keeping room type and amenities consistent. For lead-to-lease conversion, divide completed move-ins by qualified inquiries for the same cohort and period. The result is useful only if your definition of “qualified inquiry” stays consistent.
Validate your conclusion on a later holdout period rather than judging it only on the data used to find the pattern. Avoid adding more variables because they improve the historical fit. A model that reacts to every amenity, holiday, listing edit, and weather change may describe the past beautifully while offering weak guidance for the next vacancy.
Conditions change, so refresh your rules. The Agentic AI time series solutions overview from Faberwork LLC provides broader context for automating time-series workflows. For a small operator, a spreadsheet with disciplined definitions may be enough. Automation becomes useful when it preserves those definitions instead of hiding them.
A short video can also help visualize the process:
The best analysis leaves you with a decision and a reason, not just a chart.
Turning Trends Into Pricing Rules and Operating Cadence
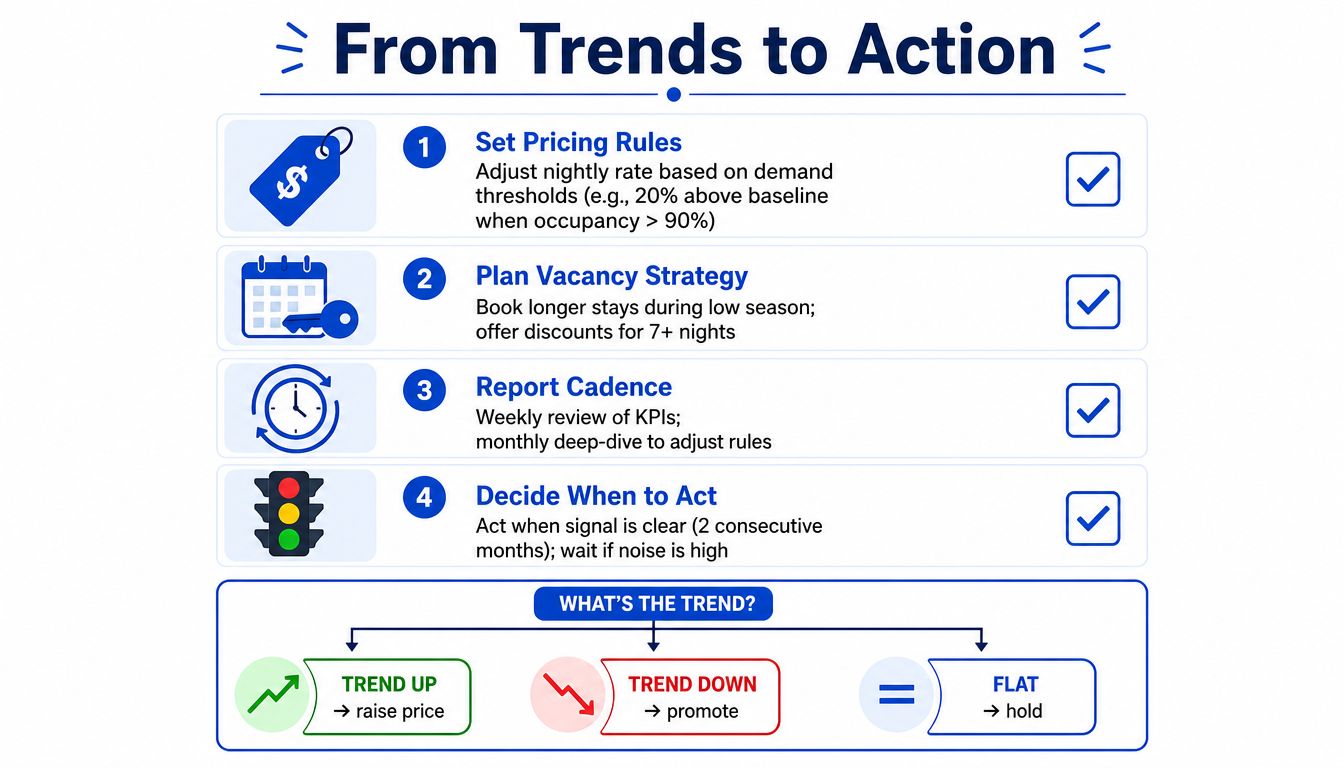
Analysis only improves NOI when it changes what you do. A useful pricing rule connects a defined signal to a specific action, then gives you a reason to hold or reverse the decision.
Start with the room, not the portfolio average. If one house has stronger inquiry quality and fewer comparable vacancies, it may support a higher price even when another house nearby needs promotion. If a room has weak inquiry volume but strong comparable demand, inspect the listing and response process before cutting price.
Write the rule before the vacancy arrives
A practical rule includes five parts:
- Signal: What changed, such as comparable availability, inquiry quality, or your vacancy days.
- Threshold: What level of movement qualifies for action.
- Action: Raise, lower, hold, promote, improve the listing, or adjust terms.
- Review date: When you'll evaluate the result.
- Invalidation condition: What would show the signal was noise.
Don't use a price change to solve every problem. A low inquiry count may reflect weak photos or a slow response time. A high inquiry count with few move-ins may point to qualification, house rules, or price resistance. Pricing is only one lever.
Match review speed to the signal
Competitive moves deserve frequent observation. Check live listings, room availability, and major changes in your own inquiry flow on a daily or weekly basis when a vacancy is active. Conduct a deeper trend review monthly, when you can compare occupancy, rent movement, retention, supply, and lead quality together.
Separate signal identification from resource allocation. First decide whether the market appears to be moving. Then decide whether the opportunity is large and reliable enough to justify a renovation, advertising budget, staffing change, or portfolio repositioning.
Decision rule: Act when the evidence is consistent, local, and tied to a clear operating outcome. Wait when the signal depends on one unusual observation.
Connect pricing to the P&L
A higher advertised rent isn't automatically better for NOI if vacancy lasts longer or turnover costs rise. Track the price decision alongside gross room revenue, vacancy loss, marketing expense, repairs, utilities, and resident turnover.
Your report should make it possible to answer:
- Which house changed price?
- What evidence supported the change?
- Did the room fill faster, slower, or at the same pace?
- Did the change affect retention or lead quality?
- Should the rule remain, be adjusted, or be removed?
Portfolio analytics can expose differences that house-level reviews miss, while house-level analysis prevents a strong property from masking a weak one. Resources on competitive pricing intelligence can help frame that comparison, especially when you need to distinguish a competitor's advertised price from the price your room can support.
A disciplined cadence beats constant tinkering. Review active competitive changes frequently, conduct a monthly deep dive, and document every material pricing move. The objective isn't to change prices more often. It's to make fewer, better-justified changes.
Your Next Moves to Make Trend Analysis a Habit
Market trend analysis becomes useful when it turns into a repeatable loop:
Define, collect, clean, analyze, act, and verify.
Start with one submarket and a small set of comparable rooms. Track the same measures every review period, keep your definitions stable, and write down the reason behind each pricing or marketing change.
Use the next month to build the habit:
- Create a watchlist: Save comparable rooms by ZIP code, room type, amenities, and price range.
- Review weekly: Check new listings, advertised rents, inquiry volume, and active vacancies.
- Review monthly: Compare occupancy, lead-to-lease conversion, retention, supply, and pricing movement.
- Test one rule: Choose one room or house and connect a defined signal to a specific pricing or marketing action.
- Verify the result: Record what happened and whether the evidence supported the original assumption.
Don't wait for a large annual report to tell you what your next vacancy needs. Broad forecasts can provide context, but local observations reveal where your returns are improving or weakening. As one global forecasting example, Goldman Sachs Research projected 2.8% global growth in 2026, compared with a 2.5% consensus forecast, while The Business Research Company valued global markets at $286.4 trillion in 2025 and forecast a 6.6% CAGR through 2035, as summarized in Snowflake's trend analysis overview. Those figures show the scale of macro forecasting, but they can't set the right price for a particular room.
Small, consistent reads beat occasional big reports. When you connect local demand signals to clear operating rules, you can respond to vacancies faster, avoid unnecessary discounts, and make NOI decisions with evidence instead of instinct.
PadPulse is being built to help PadSplit hosts and co-living operators bring comparable rents, demand signals, dynamic pricing, P&L tracking, and portfolio analytics into one workflow. Visit PadPulse to join the interest list for launch updates and potential beta access, then start building the market intelligence habit before your next vacancy.