Market Comparison Analysis for Room Rentals That Price Right
September 15, 2026
You've got a room sitting vacant, so you check nearby listings and choose a price that feels competitive. A few days later, inquiries slow down. Then you discover that the closest listing included utilities, parking, and furniture, while your room offered only the bedroom. The advertised rent looked similar, but the resident's monthly value wasn't.
That's where market comparison analysis becomes useful for room rentals. Instead of copying an apartment average or matching the nearest listing, you compare rooms with similar features, lease structures, occupancy conditions, and resident experiences. The result is a pricing decision you can explain, monitor, and adjust as the market changes.
Why Market Comparison Analysis Matters for Pad Style Rentals
Comparative market analysis has long been a core real-estate pricing method. The Northwest Multiple Listing Service's history of comparative market analysis describes a CMA as an estimate based on recently sold, similar nearby properties. Brokers use that logic to help sellers set listing prices and buyers make competitive offers.
For pad-style rentals, the same principle applies, but the subject being priced is usually one room, not an entire house or apartment. A three-bedroom house with three rentable rooms has a different pricing problem from a conventional three-bedroom apartment. Residents compare their private room, shared spaces, utilities, furnishings, access, and house rules. They don't evaluate the whole property as an owner or conventional tenant would.
A unit-level average can therefore create a false anchor. An apartment listing might show one monthly figure, while a room-by-room operator needs to determine what each private room should contribute to total revenue. The smallest room may need a lower price, the primary bedroom may justify a premium, and a furnished room with utilities included may compete with a different set of alternatives entirely.
What a useful analysis should deliver
A practical analysis should answer more than “What's the average rent nearby?” It should help you establish:
- A defensible room price: The proposed rent reflects comparable private rooms rather than unrelated unit totals.
- A competitive price band: You know the lower, middle, and upper positions available in the local market.
- A vacancy response: You can identify when a room needs a price change, a concession, or better positioning.
- A clearer revenue forecast: Room-level pricing gives your property-level income model more realistic inputs.
- A repeatable decision process: Another person reviewing the work can understand which comps were selected and why.
Practical rule: A comp is useful because it resembles the resident's alternative, not merely because it's close to your property.
When to run one
Run a fresh analysis before launching a new house, after changing furnishings or utilities, when several rooms remain vacant, or when nearby supply changes materially. Operators who wait for an annual review can miss local shifts in demand and affordability.
The local market intelligence guide is a useful companion for thinking beyond a single rent figure. The strongest workflow treats market comparison analysis as ongoing pricing discipline, moving from a clearly defined comp set to normalized values and then to operational action.
Defining Your True Comparable Set for Room by Room Pricing
Start with the room you're pricing, not with a map search. Write down its private-room size, bedroom position in the house, bathroom arrangement, furnishing package, utility policy, parking, access controls, shared amenities, lease term, deposit requirements, and current condition. These details define the resident's choice set.
Then create inclusion rules before reviewing the results. OECD guidance on competition measurement recommends combining multiple lenses and standardizing data so comparisons use common definitions. Its methodologies for measuring market competition support a disciplined process that reconciles different data sources rather than relying on one convenient benchmark.
Filter for the resident's actual alternatives
Use these filters as a starting point:
- Bedroom count and room type: Compare a private room with private rooms first. Separate primary bedrooms, smaller bedrooms, rooms with private bathrooms, and rooms sharing a bathroom.
- Property type: A room in a shared house competes differently from a conventional apartment, extended-stay unit, or full single-family rental.
- Building age and condition: A renovated house shouldn't be treated as identical to a dated property because both offer the same bedroom count.
- Furnished status: Furniture changes the resident's move-in cost and convenience. Keep furnished and unfurnished listings separate unless you can make a clear adjustment.
- Utilities and services: Note whether electricity, water, internet, trash, cleaning, and other services are bundled or billed separately.
- Amenity bundle: Smart locks, laundry access, parking, outdoor space, workspace, and quality shared kitchens can affect the comparison.
- Lease structure: Monthly flexibility, fixed terms, master-lease arrangements, and other structures can attract different residents and produce different effective pricing.
Distance still matters, but it shouldn't override fit. A slightly farther room in the same submarket may be more relevant than the nearest apartment if it matches the same lease style and amenity package. Rent-comparison guidance commonly refines comps using price, size, distance, and recency, while filtering by bedroom count, property type, and building age. The comparable property analysis framework can help operators organize those distinctions.
Freeze the set before checking the outcome
Document the geographic boundary, property types, acceptable age range, room categories, furnishing rules, utility treatment, and observation date. Don't remove an inconvenient comp just because it weakens the price you hoped to achieve.
A good comp sheet should record the listing address or property identifier, room description, advertised rent, included services, availability, source, and date captured. Mark each entry as include, exclude, or review, with a short reason. That record protects you from cherry-picking and makes your next update faster.
Where to Find Reliable Data and How to Judge Quality
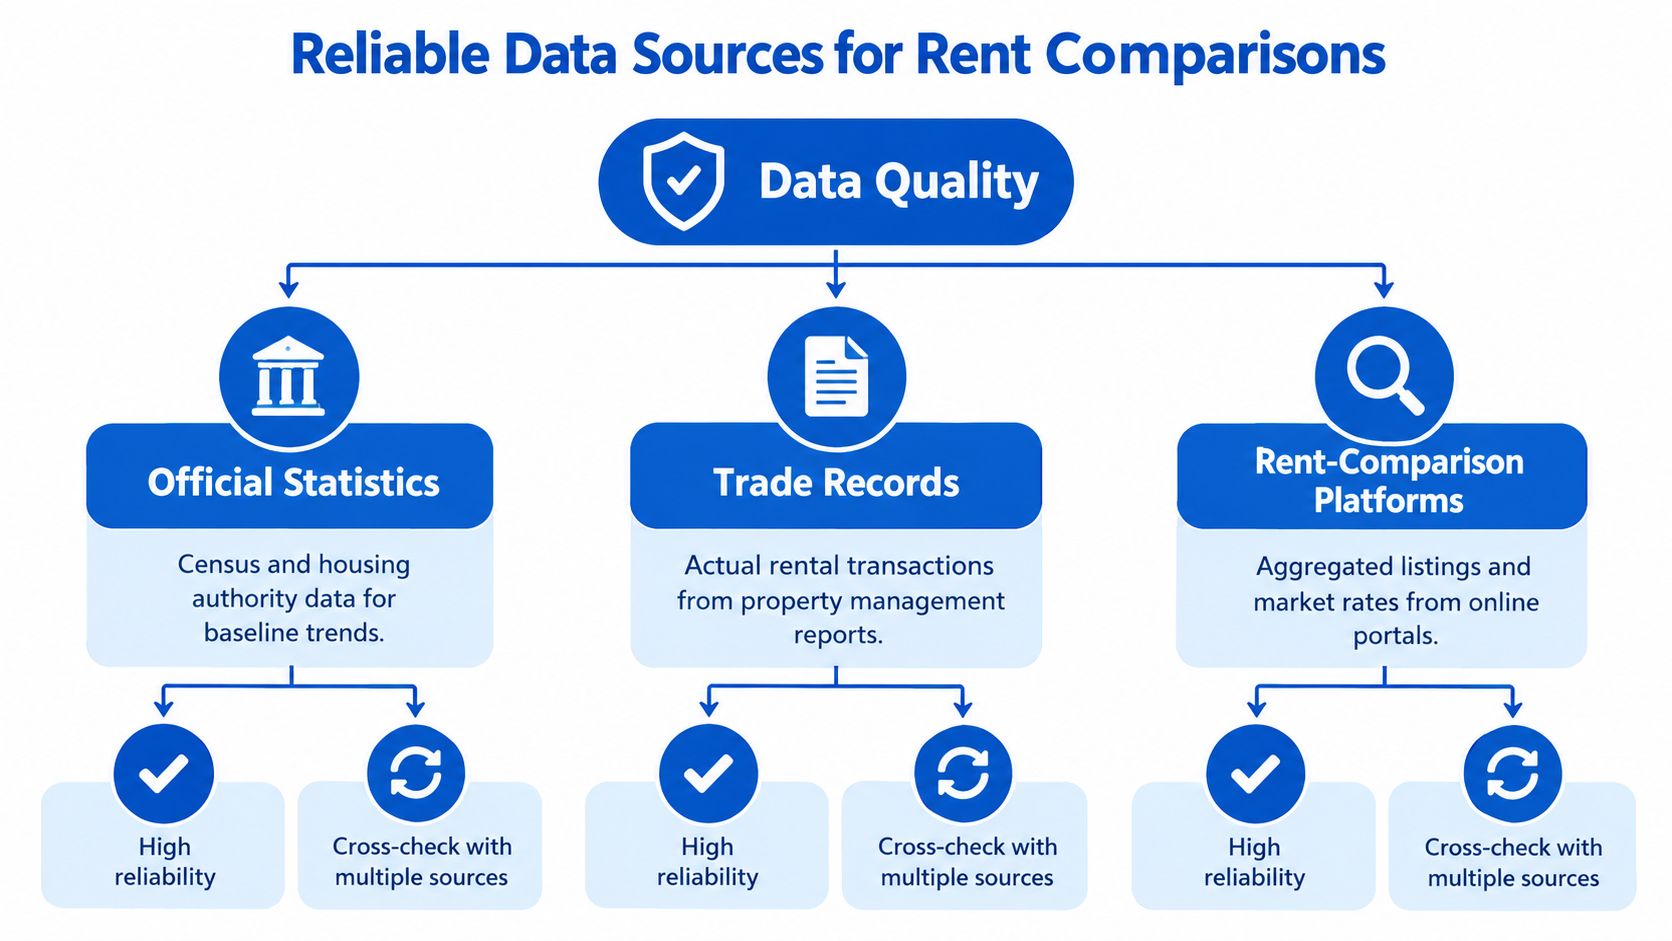
No single source gives a complete picture of a room-rental market. Official statistics can establish broad vacancy and affordability context. Trade records and property-management reports can provide closer insight into actual leasing activity. Rent-comparison platforms can help you locate nearby listings, historical trends, public property information, and market insights.
The best approach is to combine these sources, then reconcile their definitions. A listing may show asking rent, while an internal report may show a signed lease. One source may describe a property as furnished because it includes basic appliances, while another uses the term only for a move-in-ready bedroom. Those records aren't comparable until you label the differences.
Use the right source for the right question
Official statistics are strongest for market context. The U.S. Census Housing Vacancies and Homeownership report places the national rental vacancy rate at 7.3% in the second quarter of 2026, with a median asking rent of $1,531 for vacant for-rent units. Those figures aren't a substitute for room-level comps, but they provide a reference point for broader demand and pricing conditions. See the U.S. Census vacancy and rent report for the underlying benchmark.
Trade records and company disclosures can clarify actual operating conditions, including lease activity, concessions, occupancy, and property performance. They're especially helpful when listings remain active for long periods or when asking prices appear disconnected from signed rents.
Rent-comparison platforms are useful for discovery and trend review. One platform's Pro Report for rent comparison highlights estimated, average, and median rent, the 25th to 75th percentile range, comparable-rental count, search radius, and historical trend views. Those fields matter because a median without sample context can give false confidence.
Judge quality with more than a headline rent
Review each data set for:
- Freshness: Recent address-level observations usually help with immediate repricing, while annual benchmarks are better for broader context.
- Sample size: A larger, relevant comp pool generally gives you more confidence than an isolated listing.
- Distribution: Compare average, median, and percentile ranges. A wide spread may signal mixed room types or inconsistent property quality.
- Geographic radius: A tight radius can improve relevance, but an overly narrow search may leave you with too little usable evidence.
- Time series: A trend view helps distinguish a one-off listing from a persistent movement.
- Definition consistency: Confirm that rents refer to the same room type, lease period, furnishing level, and utility treatment.
The market intelligence platform overview provides useful context for the broader data workflow. The goal isn't to collect every available number. It's to build a clean, traceable set that answers the pricing question you have.
Normalizing Comps and Adjusting for Occupancy and Seasonality
Raw rents aren't apples-to-apples. Before placing your room against the market, convert each comp into a common format, such as monthly effective rent for a comparable private room, then adjust for meaningful differences.
Begin with physical features. Separate room categories by size, bathroom access, natural light, storage, and location within the house. Avoid dividing the entire property rent evenly across bedrooms. Residents often value private bathrooms, larger floor plans, and quieter locations differently.
Next, normalize the economic package:
- Convert the lease term to a monthly figure. A short flexible term may command a different price from a longer commitment.
- Separate base rent from bundled services. Record which utilities and services are included.
- Identify furnishings. Treat furniture as part of the resident's value package, not as an incidental detail.
- Account for concessions. Convert discounts or free periods into an effective rate rather than comparing only the advertised figure.
- Adjust for amenities. Parking, smart access, laundry, internet, and shared-space quality should be visible in the comparison record.
A simple room-level adjustment
Suppose a nearby comp advertises a $650 monthly room rent. Your target room is furnished and includes utilities, while the comp is unfurnished and bills utilities separately. Don't claim that the target should automatically rent above $650. Instead, create explicit adjustment lines in your worksheet.
| Adjustment Factor | How to Apply | Example Impact |
|---|---|---|
| Room category | Compare primary rooms, standard rooms, and rooms with private bathrooms separately | Move the comp into the same room category before using it |
| Furnishings | Add a documented furnishing adjustment or compare only with furnished rooms | The $650 comp may require an upward adjustment if your room includes furniture |
| Utilities | Estimate the recurring resident cost represented by included services | The target's effective value may exceed the advertised $650 |
| Lease flexibility | Compare similar term lengths and renewal conditions | A flexible arrangement may need a separate price position |
| Occupancy conditions | Use local vacancy and current availability as a market pressure check | Elevated vacancy can justify a more conservative price |
| Seasonality | Review historical movement and current leasing velocity | Hold, raise, or reduce the price based on current demand signals |
The calculation is deliberately transparent: normalized room value = advertised rent + furnishing adjustment + utility adjustment + amenity adjustment, followed by a market-condition adjustment. If your documented furnishing value is $40 and the included utility package is $60, the unadjusted equivalent of the $650 comp would be $750 before considering occupancy pressure. Those adjustment amounts are an example of worksheet logic, not a universal market rule. Use your own observed costs and resident behavior.
Add occupancy and seasonality carefully
Vacancy changes the pricing decision, but it shouldn't replace comp analysis. The Census benchmark cited above can anchor broad context, while local availability, inquiry volume, showing activity, and signed leases tell you what's happening at the room level.
Avoid reacting to one quiet week. Compare current availability with a rolling history, watch whether similar rooms are filling, and record the date each price changed. A market comparison analysis becomes more useful when it explains not only where your price sits, but also why you chose that position under current demand conditions.
Common Pitfalls That Skew Your Results and How to Avoid Them
Most bad pricing decisions don't come from arithmetic errors. They come from inconsistent comparisons. An operator can build a polished spreadsheet and still reach the wrong conclusion if the comp set changes whenever the result becomes uncomfortable.
OECD market-study guidance recommends using consistent time windows, fixing the comparator set before reviewing results, comparing rates rather than totals, and separating measured data from estimates. Its market-study methodology guidance9/en/pdf) also emphasizes descriptive measures such as average prices, volumes, supplier counts, concentration, and price variability across multiple periods.
The mistakes that create false confidence
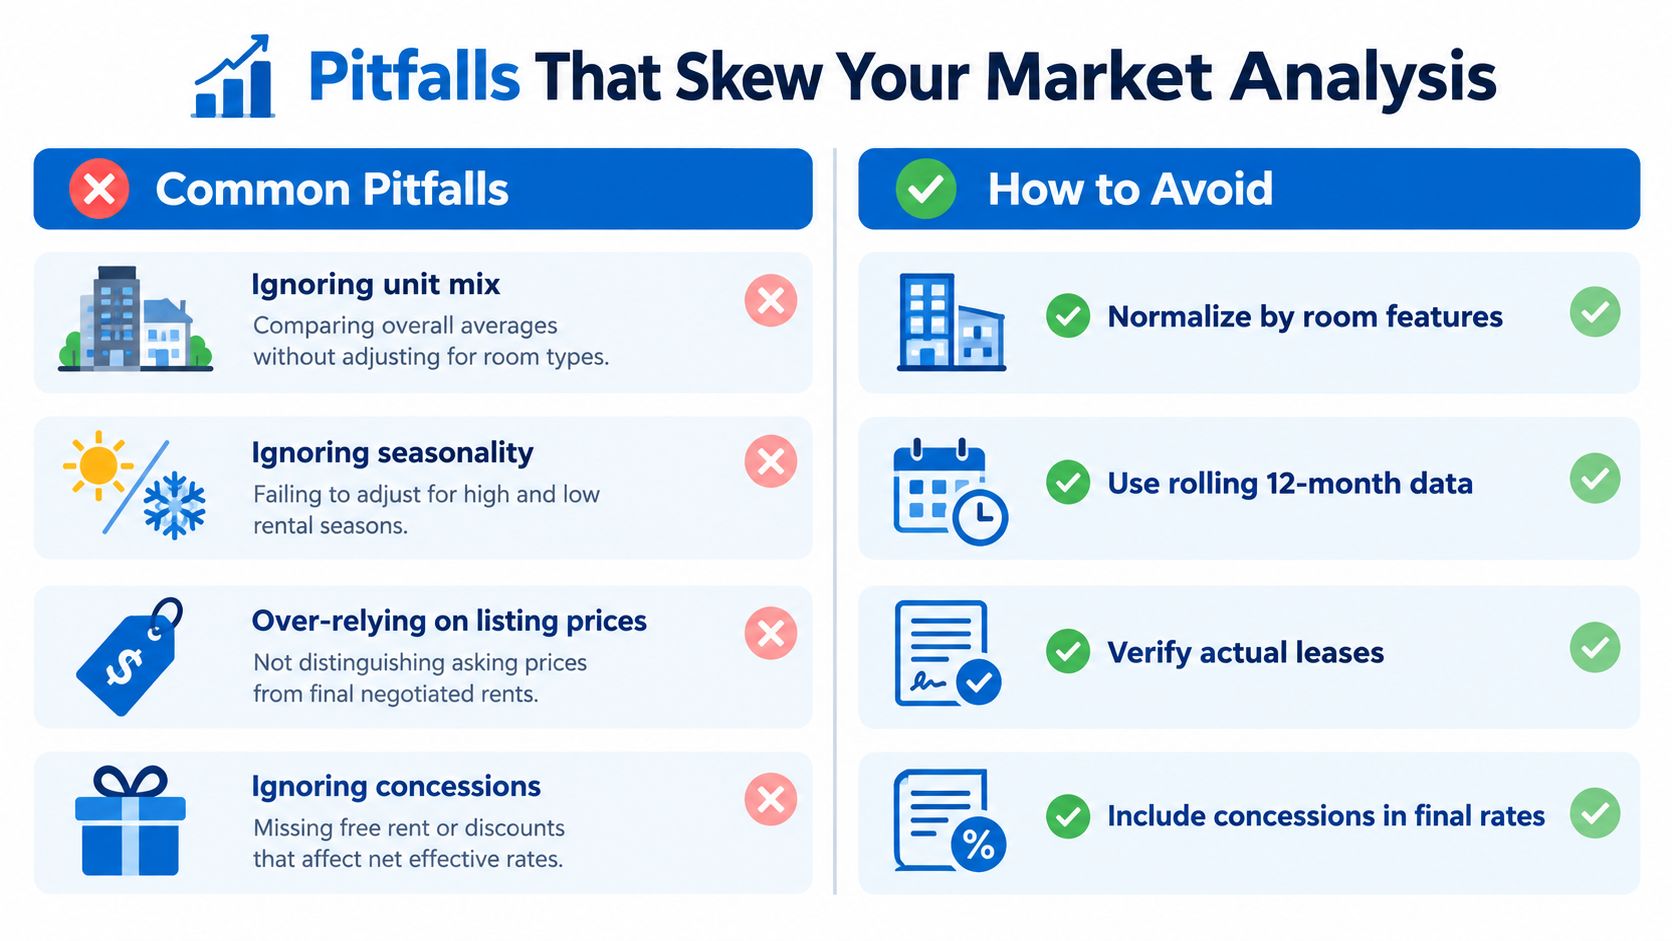
| Skewing practice | Why it fails | Better check |
|---|---|---|
| Changing the comp set after seeing prices | You can unconsciously select evidence that supports a preferred rent | Freeze inclusion rules first |
| Mixing time windows | Old and current listings may reflect different demand conditions | Capture comparable dates and label every observation |
| Comparing total property revenue | A house with more rooms can look stronger without producing better room economics | Compare room-level rates and effective revenue |
| Mixing asking and signed rents | Advertised prices show competition, not necessarily completed leasing outcomes | Separate listings, applications, and signed leases |
| Ignoring concessions | Discounts can make a high advertised rent less expensive in practice | Calculate the effective rate |
| Overlooking price variability | A single average hides how widely similar rooms are priced | Review median, average, and percentile spread |
| Ignoring unit mix | A property-wide average can conceal weak or premium room categories | Segment by room type and feature set |
| Treating seasonality as noise | Demand patterns can make a normal price look wrong at the wrong time | Compare current conditions with historical trends |
A quick self-check catches many problems. Ask whether every comp would be a realistic alternative for the same resident, whether every rent uses the same monthly basis, and whether each adjustment is documented rather than assumed.
Self-check: If you can't explain why a comp belongs in the set without mentioning its price, it may not be a true comp.
Listing prices still have value because they show the alternatives residents can see today. They're weaker evidence for achieved pricing, particularly when listings remain available, include concessions, or differ in utility structure. Keep those distinctions visible instead of blending everything into one average.
Turning Insights Into Dynamic Pricing and Operational Decisions
A normalized comp set gives you a market position. Operations determine what you do with it.
Set a price band rather than treating one calculated figure as absolute. Use the observed distribution of relevant rooms to identify a defensible lower, middle, and upper position. Then choose where your room sits based on condition, furnishing, utility bundle, lease flexibility, current availability, and the urgency of filling it.

Hold, raise, or reduce
Use a simple operating rule:
- Hold the price when the room matches its comp band, inquiries remain healthy, and comparable inventory isn't undercutting you.
- Raise the price when the room consistently attracts qualified demand, fills faster than similar rooms, or offers a stronger package than nearby alternatives.
- Reduce or repackage when comparable rooms are available at lower effective rates, inquiries are weak, or vacancy is increasing. Test a utility bundle, furnishing change, or targeted concession instead of cutting base rent automatically.
Price changes should also flow into your property-level P&L. Track asking rent, effective rent, days available, occupancy, concessions, utility costs, and maintenance costs by room. A higher headline price can produce weaker NOI if it creates extended vacancy or adds expensive bundled services.
For a broader view of demand and market movement, real-estate analytics providers such as Yardi Matrix track lease comps, vacancy projections, property performance, demographic trends, and peer comparisons across 3,000+ markets and submarkets. That kind of coverage can complement, but not replace, the local room-level evidence you collect yourself.
Review the signals on a monthly rhythm
A monthly review is frequent enough to catch meaningful changes without encouraging impulsive daily reactions. Recheck the active comp set, new room availability, effective pricing, inquiry quality, lease conversions, and affordability pressure. Realtor.com's 2026 housing market alignment analysis describes a more balanced U.S. housing market, with the gap between listing prices and buyer interest narrowing. Room operators should interpret broad signals alongside their own submarket data, not assume a national direction applies uniformly to every house.
Use this short decision checklist:
- Has the room's feature package changed?
- Are the closest true comps priced differently after normalization?
- Is local availability tightening or expanding?
- Are inquiries converting, or are prospects objecting to price?
- Are utilities and concessions reducing effective revenue?
- Does the proposed price support both occupancy and target NOI?
A market comparison analysis is most valuable when it becomes a living operating record rather than a one-time report. Review the evidence, document the decision, and watch what happens after each change.
PadPulse is being built for room-by-room operators who need comparable rents, demand signals, dynamic repricing, vacancy tracking, and clear P&L visibility in one workflow. Visit PadPulse to join the interest list for limited beta access, product updates, and referral opportunities, with no billing required before launch.