Housing Market Data by ZIP Code: A Practical Guide
September 30, 2026
A citywide rent average can make a co-living house look correctly priced while individual rooms sit empty. The problem usually isn't the property itself. It's that demand, affordability, inventory, and renter preferences change across short distances, and a citywide figure smooths away the differences that determine whether a room leases this week.
Housing market data by ZIP code gives operators a more useful starting point. It connects indexed rents and prices with supply, market speed, household characteristics, and local affordability. The result isn't a perfect forecast, but it can help you price rooms with less guesswork, explain neighborhood selection to investors, and identify which properties deserve attention before occupancy weakens.
Why ZIP-Level Housing Data Changes How You Price Rooms
A co-living operator in a mid-sized city once priced every room from the same citywide rent average. The average looked reasonable in the acquisition model, so the operator applied it across a house near a university, another property near the industrial edge, and several nearby neighborhoods.
Occupancy told a different story. The ZIPs bordering the university supported a clear premium, while the industrial-edge ZIP attracted a more price-sensitive renter. The operator had underpriced rooms where demand was strongest and overestimated what renters would pay in the slower pocket. Vacancies persisted, revenue fell, and the citywide average offered no clear explanation.
That scenario is common because a room-by-room rental competes against more than apartments. It competes against other rooms, studios, shared houses, employer housing, student housing, and the renter's commute. A ZIP boundary can capture a meaningful difference in access, housing stock, employment, or renter profile that a metro-wide average misses.
Practical rule: Use a citywide average to screen a market. Use ZIP-level evidence to price a room.
The signal behind the average
A useful ZIP analysis combines several types of evidence:
- Rent direction: Is the local rent index rising, flat, or losing momentum?
- Market speed: Are listings being absorbed quickly, or are they lingering?
- Supply pressure: Are new listings and completed units giving renters more choice?
- Affordability: Do local incomes support your target room rate?
- Housing composition: Does the area contain the kind of stock that can support room-by-room demand?
FHFA's House Price Index coverage demonstrates why geographic detail matters. Its products cover national, state, metro, county, ZIP code, and census tract levels, with historical data extending back to the mid-1970s and an underlying dataset built from tens of millions of home sales. That depth makes an indexed price series more useful for identifying direction than a single asking-price snapshot.
For operators, the practical benefit is speed without needless complexity. You don't need a spreadsheet containing every listing in a city. You need a repeatable ZIP score that tells you whether to hold the rate, test a premium, improve the listing, or offer a concession before a vacancy becomes expensive.
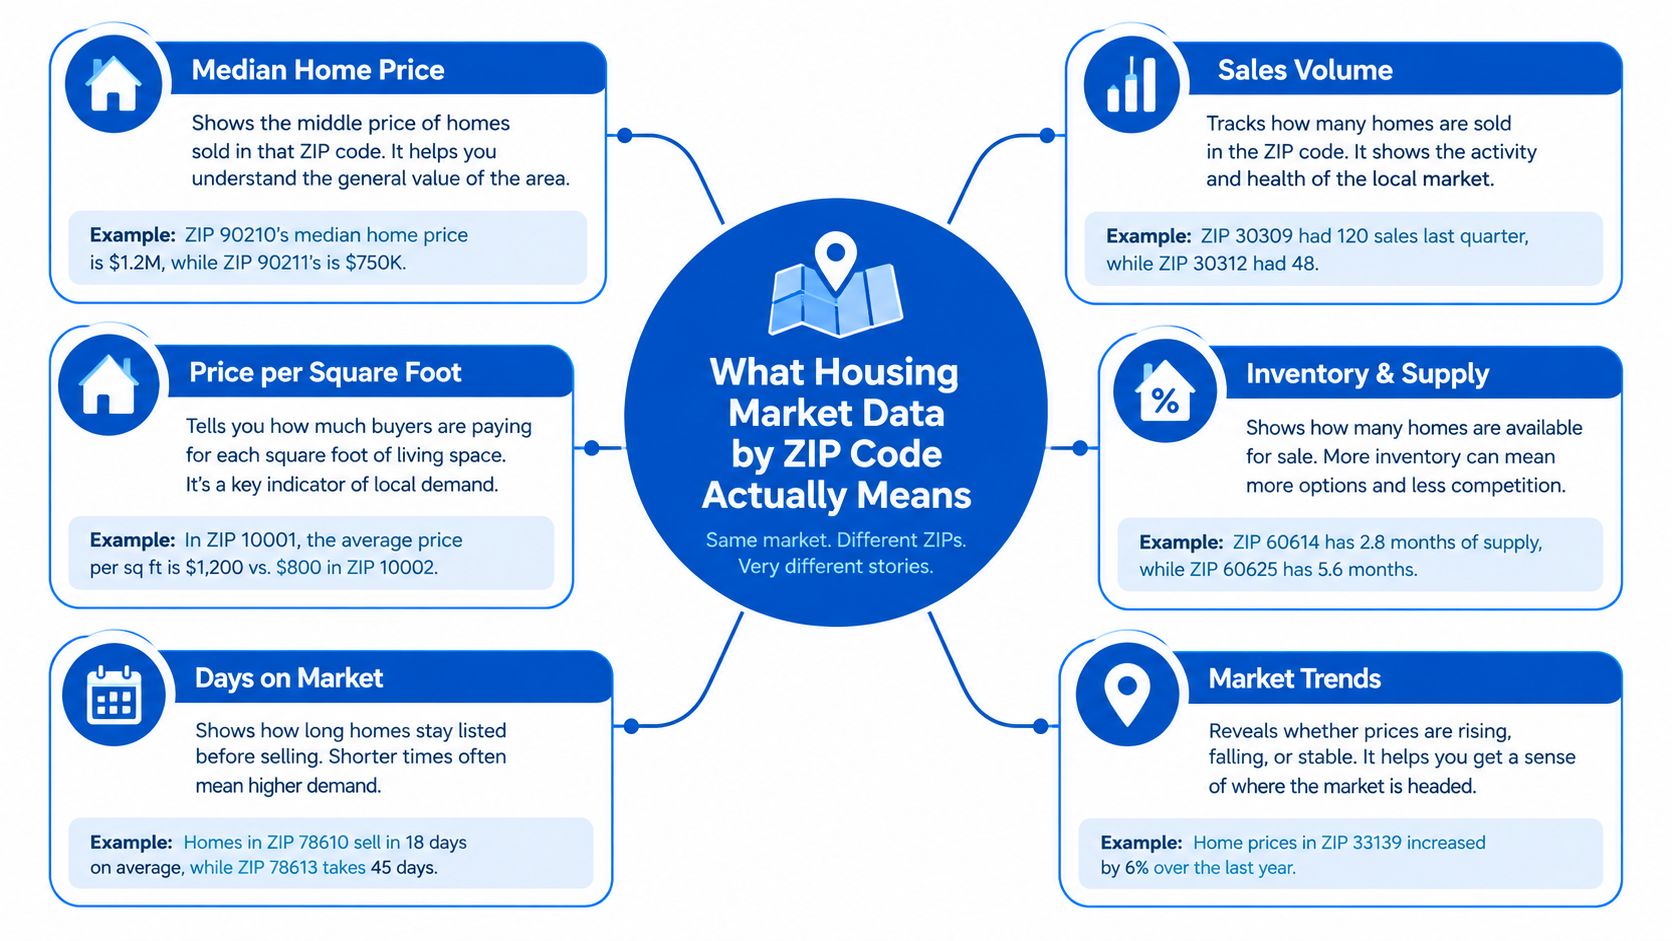
What Housing Market Data by ZIP Code Actually Means
Think of each ZIP as a neighborhood fingerprint. It carries a distinct pattern of rents, sale prices, listing duration, inventory, household composition, turnover, and affordability. A citywide figure blends those fingerprints together, which can hide the conditions that influence room demand.
The word “ZIP” also creates a technical trap. The U.S. Census Bureau generally uses ZIP Code Tabulation Areas, or ZCTAs, for demographic and housing analysis. A ZCTA is a statistical approximation of a postal ZIP code, not a direct copy of the boundaries used by the U.S. Postal Service. The Census explanation of ZIP-code geography distinguishes ZCTAs from five-digit ZIP-code geography used in other business datasets.
That distinction matters because postal ZIP codes can serve post-office boxes or unique users without representing a conventional residential area. A property address may also sit close to a boundary, while its Census data belongs to a ZCTA that doesn't align perfectly with the operator's marketing area.
What a ZIP data bundle contains
A practical housing market data set may include:
- Indexed rent series, which show direction relative to a historical baseline.
- Median sale prices and price trends, useful for acquisition and refinancing context.
- Listing inventory and days on market, which reveal market speed.
- Vacancy and absorption indicators, where reliable local data is available.
- Income and tenure data, including renter share and housing-cost burden.
- Housing-stock overlays, such as structure type, age, rooms, and occupancy.
The Census ACS Data Profiles add useful context through ZCTA-level fields for occupancy, housing tenure, structure type, year built, value, gross rent, and gross rent as a share of household income. Those fields won't tell you whether one room has a better view or a quieter floor, but they can show whether a ZIP's housing stock and affordability profile fit your operating model.
The key is to label every source by geography. “ZIP rent” may mean a ZCTA estimate, a postal area, a listing feed, or a model that assigns metro data downward. Treating those as interchangeable is one of the fastest ways to build a misleading comp set.
The Most Trusted ZIP-Code Data Sources Compared
No single source answers every co-living question. Public data usually provides transparency and broad coverage, while commercial products can offer faster updates, cleaner interfaces, or more detailed listing intelligence. The trade-off is that faster data may be modeled, indexed, incomplete, or dependent on proprietary coverage.
The public baseline
The Census ACS is the broadest starting point for household and housing characteristics. It helps you understand income, renter share, tenure, housing costs, and the physical composition of the stock. Its weakness is latency. It's a structural baseline, not a live rent-setting instrument.
HUD's Small Area Fair Market Rents, or SAFMRs, provide a policy-grade rent benchmark at the ZIP-code level. HUD calculates estimates using adjusted-standard-quality gross rents from the ACS and applies recent-mover, inflation, and local market adjustments from the parent metro or county. That makes SAFMR useful as an affordability anchor, although it isn't a direct measure of the price a furnished room with utilities can command.
FHFA is especially valuable for long-run home-price direction. Its House Price Index datasets include ZIP-code products and a three-digit ZIP developmental index. The index is better for tracking change than for valuing a particular room or property.
Commercial and listing-based sources
Zillow distributes ZIP-level historical measures including the Zillow Home Value Index, the Zillow Observed Rent Index, inventory, and sale prices. Its research data overview explains that many datasets reach back to the late 1990s and that ZIP forecasts can be derived by attributing metro forecasts to ZIPs according to historical correlation. That makes Zillow useful for direction, but operators should remember that a metro-derived forecast isn't the same as a locally observed forecast.
Redfin's Data Center can add sale-side context, including pricing and velocity measures where coverage is available. BLS LAUS can provide employment context, but employment data may be reported at a geography broader than the property's ZIP. CoStar, RentCast, and multi-feed aggregators can reduce manual work, but their coverage, definitions, update schedules, and access terms require careful review.
| Source | Coverage | Strength | Weakness |
|---|---|---|---|
| Census ACS ZCTA tables | Demographics and housing characteristics | Broad structural context | Slow-moving and not designed for weekly pricing |
| HUD SAFMR | ZIP-level rent benchmarks | Transparent policy methodology and affordability anchor | Not a room-rent forecast |
| Zillow ZHVI and ZORI | ZIP, city, county, metro, state, and neighborhood measures | Indexed price and rent direction | Some ZIP forecasts inherit metro-level assumptions |
| FHFA HPI | ZIP through national geographic levels | Long historical price-change analysis | Focuses on home prices, not room occupancy |
| Redfin Data Center | Sale-side market measures where available | Useful for price and sales velocity | Coverage and definitions vary by geography |
| BLS LAUS | Employment context | Helps connect housing demand to labor conditions | Often broader than the target ZIP |
| CoStar, RentCast, and aggregators | Commercial market and listing feeds | Faster workflows and combined data | Proprietary methods, coverage gaps, and subscription trade-offs |
Realtor.com's residential real estate data library is another useful reference for listing-based research. Its ZIP-level files include measures such as median listing price per square foot for a specified geography and month, and its research system is based on MLS-listed homes aggregated from many sources. That focus explains why listing snapshots can differ sharply from Census housing characteristics.
Key Metrics That Move a Rental Market
A room operator shouldn't watch every metric available. Track the measures that answer four questions: Can renters afford the rate? Are they searching? How much competing supply do they have? How quickly does available stock lease?
Price and affordability
Median rent provides a broad market anchor, but room rentals need a per-bedroom lens. A two-bedroom apartment and a furnished private room aren't interchangeable products. Compare the total monthly cost, including utilities, furnishings, parking, deposits, and shared amenities.
Rent per square foot helps compare properties with different layouts, but it can mislead when common areas are large or bedrooms vary significantly. Use it as a property-screening tool, then convert the analysis to an effective monthly room rate.
Median household income, renter share, and gross rent as a percentage of household income help establish a pricing floor. The Census ACS provides these affordability and housing characteristics for ZCTAs. If the proposed room rate sits far above the local affordability profile, you'll need a strong demand reason, such as a university, transit connection, or concentrated employment base.
A high rent index doesn't prove that a high room rate will work. Pair price direction with affordability and renter demand.
Velocity and supply
Days on market shows how long a listing remains active. Rising duration often signals weaker demand, stale pricing, or a mismatch between the advertised product and local expectations. Realtor.com uses unique viewers per property as a demand proxy and days active as a speed-to-sale proxy in its ZIP rankings, as described in its ZIP-code market analysis.
Listing inventory and months of supply show how much choice renters or buyers have relative to the pace of absorption. A growing supply measure should make you more cautious about renovation premiums and aggressive rate increases.
Absorption rate asks how quickly new stock gets leased or sold. A ZIP can show strong asking rents while absorbing new supply slowly. That combination usually deserves tighter pricing tests and stronger concessions rather than automatic rent growth.
Price-reduced share is a leading warning sign. If more competing listings need reductions, your initial price may still attract inquiries, but it may not convert them into signed agreements.
| Metric | What It Measures | Operator Use | Watch Threshold |
|---|---|---|---|
| Median rent | Typical advertised or observed rent level | Set a market reference for the property | Divergence from comparable room rates |
| Rent per square foot | Price relative to space | Compare unlike properties | Large gap without a clear amenity reason |
| Vacancy rate | Unoccupied housing or rental stock | Assess broad demand pressure | Persistent upward movement |
| Days on market | Listing speed | Decide whether to hold or adjust price | Rising duration across comparable listings |
| Inventory and months of supply | Available choice relative to demand | Time acquisitions and concessions | Supply growing faster than absorption |
| Absorption rate | Speed at which new stock is taken up | Forecast lease-up risk | New supply remaining active |
| Price-reduced share | Frequency of repricing | Detect downward pressure | More competing reductions |
| Income and rent burden | Local payment capacity | Set an affordability guardrail | Target rate stretching local incomes |
| Renter share and household growth | Potential renter pool | Select neighborhoods and property types | Weakening renter base or household formation |
The local market intelligence framework is useful as a reference for organizing these signals. The principle is simple: don't let one attractive metric override a deteriorating velocity or affordability picture.
Why Indexed Data Beats Raw Listings
A raw listing tells you what an owner hopes to receive today. It doesn't necessarily tell you what a tenant paid last month, whether the listing is duplicated, how long it has been active, or whether the advertised unit has unusual finishes. Coverage can also be uneven. One ZIP may have abundant online listings, while a neighboring area relies on private landlords and produces a thinner sample.
An index reduces some of that noise by comparing a ZIP with its own historical baseline. If an index moves above its starting point, the interpretation is directional: the local market is higher relative to the chosen baseline. That doesn't mean every room increased by the same amount, and it doesn't replace a current comp check.
Repeat-rent methods can be more stable because they follow rent changes across observed lease activity rather than relying only on asking prices. Apartment List and BLS rent measures illustrate the broader logic of using repeated observations to reduce the effect of changing unit quality, although the exact construction and geography differ by dataset.
HUD as a practical model
HUD's SAFMR methodology is a useful worked example. HUD begins with ACS adjusted-standard-quality gross rents at the ZIP level, then updates the base estimate using recent-mover, inflation, and local market adjustment factors from the parent metro or county. The HUD SAFMR methodology was created for voucher administration, not private co-living, but the structure offers a sensible pricing discipline.
An operator can borrow the logic without treating the result as a guaranteed rate:
- Establish the local ZIP rent level.
- Check how the parent metro is moving.
- Adjust for current local evidence and property quality.
- Compare the result with actual room-level competition.
- Keep an affordability floor and a realistic conversion target.
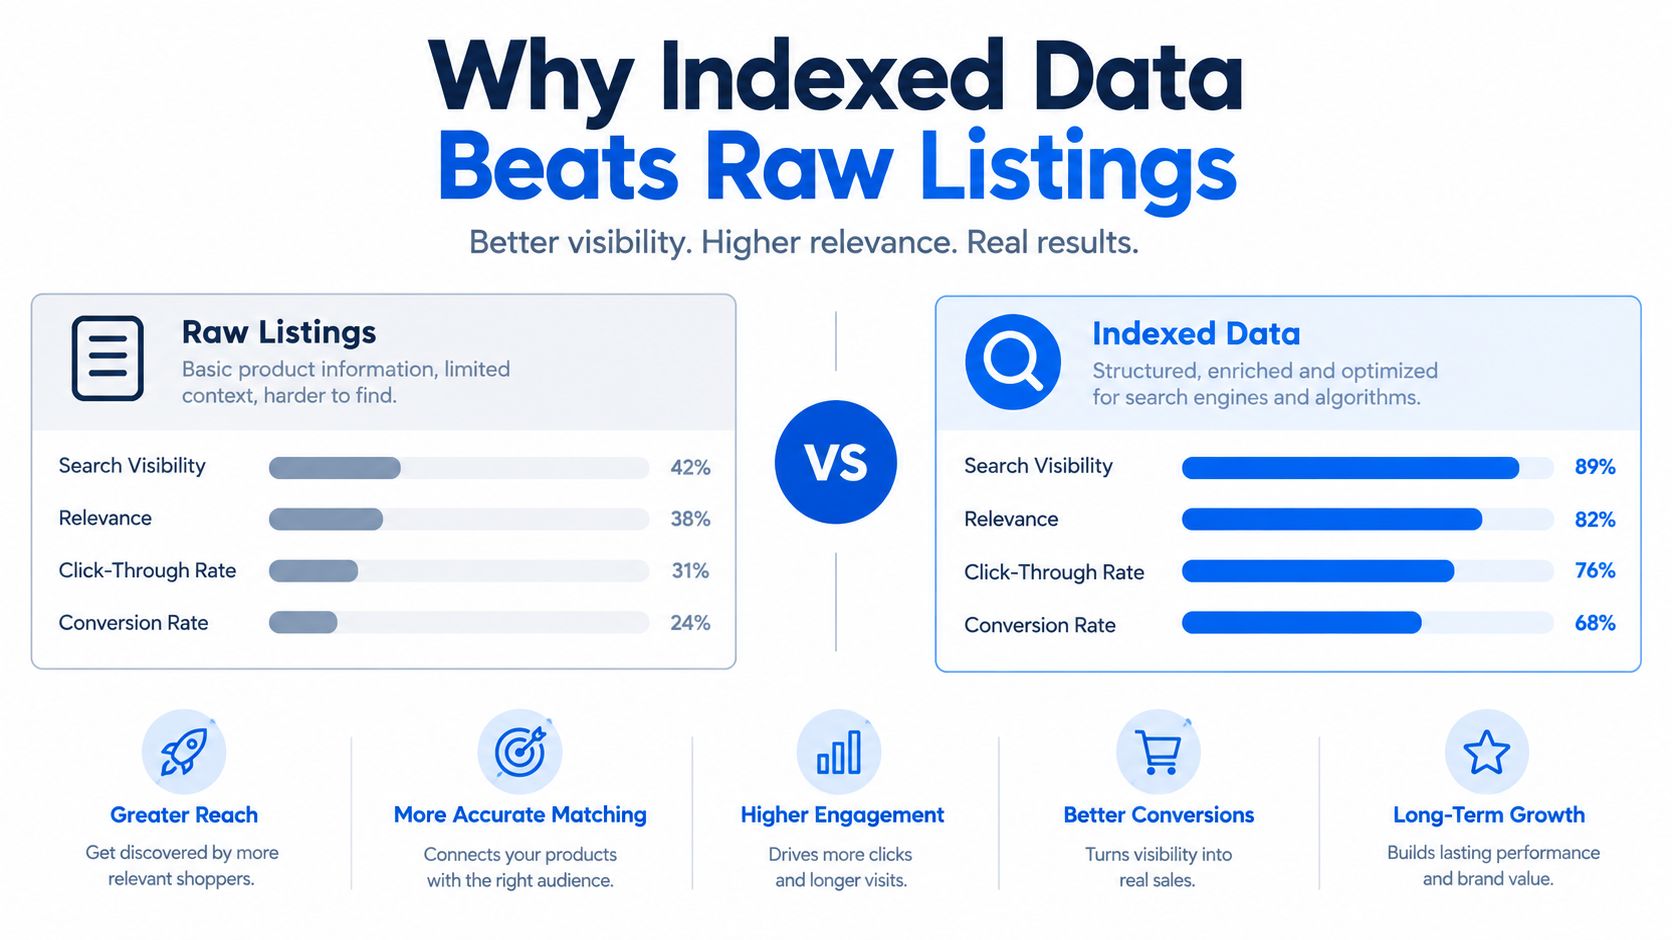
Indexed data still has limits. A thin ZIP sample can create an illusion of precision, especially when a small number of unusual properties influence the series. Treat the index as a direction signal, not a promise that every bedroom can support the same increase.
Using ZIP Data to Set Dynamic Room Pricing and Forecast Demand
Dynamic pricing works when the operator changes rates for a reason. A vague belief that “the market is hot” isn't enough. The rate should reflect the ZIP's rent direction, local supply, room quality, and the time a vacancy has already spent on the market.
Decision one dynamic room pricing
Start with the ZCTA's indexed rent trajectory and current months-of-supply direction. Use that combination to establish a base rate for the house, then layer room-level premiums for an ensuite bathroom, better natural light, a private entrance, parking, or a quieter floor.
Keep an affordability guardrail tied to the local benchmark. SAFMR can provide one reference point, while current room comps and your own conversion history show whether the product earns a premium. If inquiries are plentiful but tours don't convert, reduce friction or improve the offer before assuming the market needs a higher rate.
Decision two demand forecasting
Forecasting should combine several independent signals:
- Rent velocity: A sustained local move is more useful than one unusual listing.
- Household change: Census data can indicate whether the renter base is expanding or contracting.
- Employment and access: Major employers, transit changes, and commute patterns can reshape demand.
- Supply pipeline: New rooms or apartments can absorb demand before headline rents react.
The demand forecasting approach is most useful when it separates leading indicators from confirmation signals. For example, a new employer announcement may indicate future demand, while rising inquiries and shorter listing duration confirm that renters are already responding.
Flag a ZIP when projected supply growth appears likely to exceed household formation or when indexed rents rise while transaction velocity weakens. That combination may represent pricing strain rather than durable demand.
Decision three renovation prioritization
Rank properties by the gap between their current effective room rate and the local indexed ceiling. Then add the supply picture. A large ceiling gap in a ZIP with limited competing stock may justify capital spending, while the same gap in an oversupplied ZIP may reflect weak product-market fit.
Renovation decisions should follow the renter, not the contractor's preferred scope. Compare the likely rent effect of better lighting, durable flooring, privacy improvements, storage, acoustic treatment, and kitchen usability. A cosmetic upgrade may matter less than a reliable lock, clean common areas, or a room layout that supports a desk.
| Use Case | ZIP Data Inputs | Trigger Threshold | Operator Action |
|---|---|---|---|
| Dynamic room pricing | Indexed rent direction, months of supply, room comps | Direction and conversion move together | Test a rate change by room type |
| Demand forecasting | Rent velocity, household indicators, employment, supply pipeline | Demand signals diverge from supply growth | Revise lease-up assumptions and marketing pace |
| Renovation prioritization | Effective rate, indexed ceiling, supply, property condition | Ceiling gap is large and local supply is constrained | Fund the upgrade with the clearest revenue case |
A market-intelligence platform can automate much of this by stitching rent, supply, demographic, and comparable-property feeds into one ZIP score. The operator still needs to validate the inputs and make the final property-level judgment.
Common Pitfalls and How to Validate ZIP-Level Data
ZIP data becomes dangerous when operators treat it as a precise description of a neighborhood rather than a measurement with boundaries and timing. A USPS ZIP, a Census ZCTA, a marketing area, and a modelled ZIP forecast may all carry similar labels while representing different populations.
Census tracts also don't align neatly with postal areas. A property near a boundary can inherit a ZCTA profile that includes households with different housing stock, incomes, or access patterns. That can distort rent comparisons, especially when the sample is already small.
Timing creates false confidence
ACS and decennial Census data are useful for structure, but they don't move at the speed of a lease-up campaign. A fast-changing submarket may look affordable or under-demanded in public demographic data even after renters and employers have changed the local market.
Metro-attributed forecasts create another problem. Zillow notes that ZIP forecasts can be derived by attributing metro forecasts to ZIP codes according to each ZIP's historical correlation with its parent metro. That can be a reasonable modelling choice, but a commuting-shed neighborhood may behave differently from the metro average when access, employers, or new supply shift.
Use forecasts as scenarios, not as observed facts.
A validation routine that catches most errors
- Confirm geography: Match the property address to the source's stated geography and document whether it uses a ZCTA, postal ZIP, tract, county, or metro.
- Check sample depth: Review the number of listings, leases, or sales behind the measure. A small sample should produce a wide confidence warning, not a precise pricing decision.
- Triangulate sources: Compare an indexed series, a public affordability benchmark, and current listing or lease evidence.
- Test local reality: Compare vacancy signals with utility activity, property-manager observations, inquiry volume, and your own tour-to-lease conversion.
- Use a comparable ZIP: Re-anchor an unusual result against a nearby neighborhood with similar access, housing stock, and renter profile.
| Pitfall | Why It Misleads | Validation Fix |
|---|---|---|
| ZCTA and USPS ZIP treated as identical | Boundaries and populations may differ | Record the geography definition for every source |
| Lagged Census data used as live demand | Structural data can trail neighborhood change | Pair it with current velocity and supply signals |
| Metro forecast applied literally to a ZIP | Local commuting and employer patterns may diverge | Compare with ZIP-specific history and nearby comps |
| Thin listing sample | A few unusual properties can skew the result | Check count, property type, and observation period |
| Asking rent treated as achieved rent | Listings reflect seller expectations | Compare with signed leases or repeated observations |
| One source used as truth | Methodology gaps remain invisible | Use three independent source types |
A disciplined market comparison analysis should show the source, date, geography, sample, and limitation beside every metric. That documentation helps calm skeptical investors because it distinguishes measured evidence from an operator assumption.
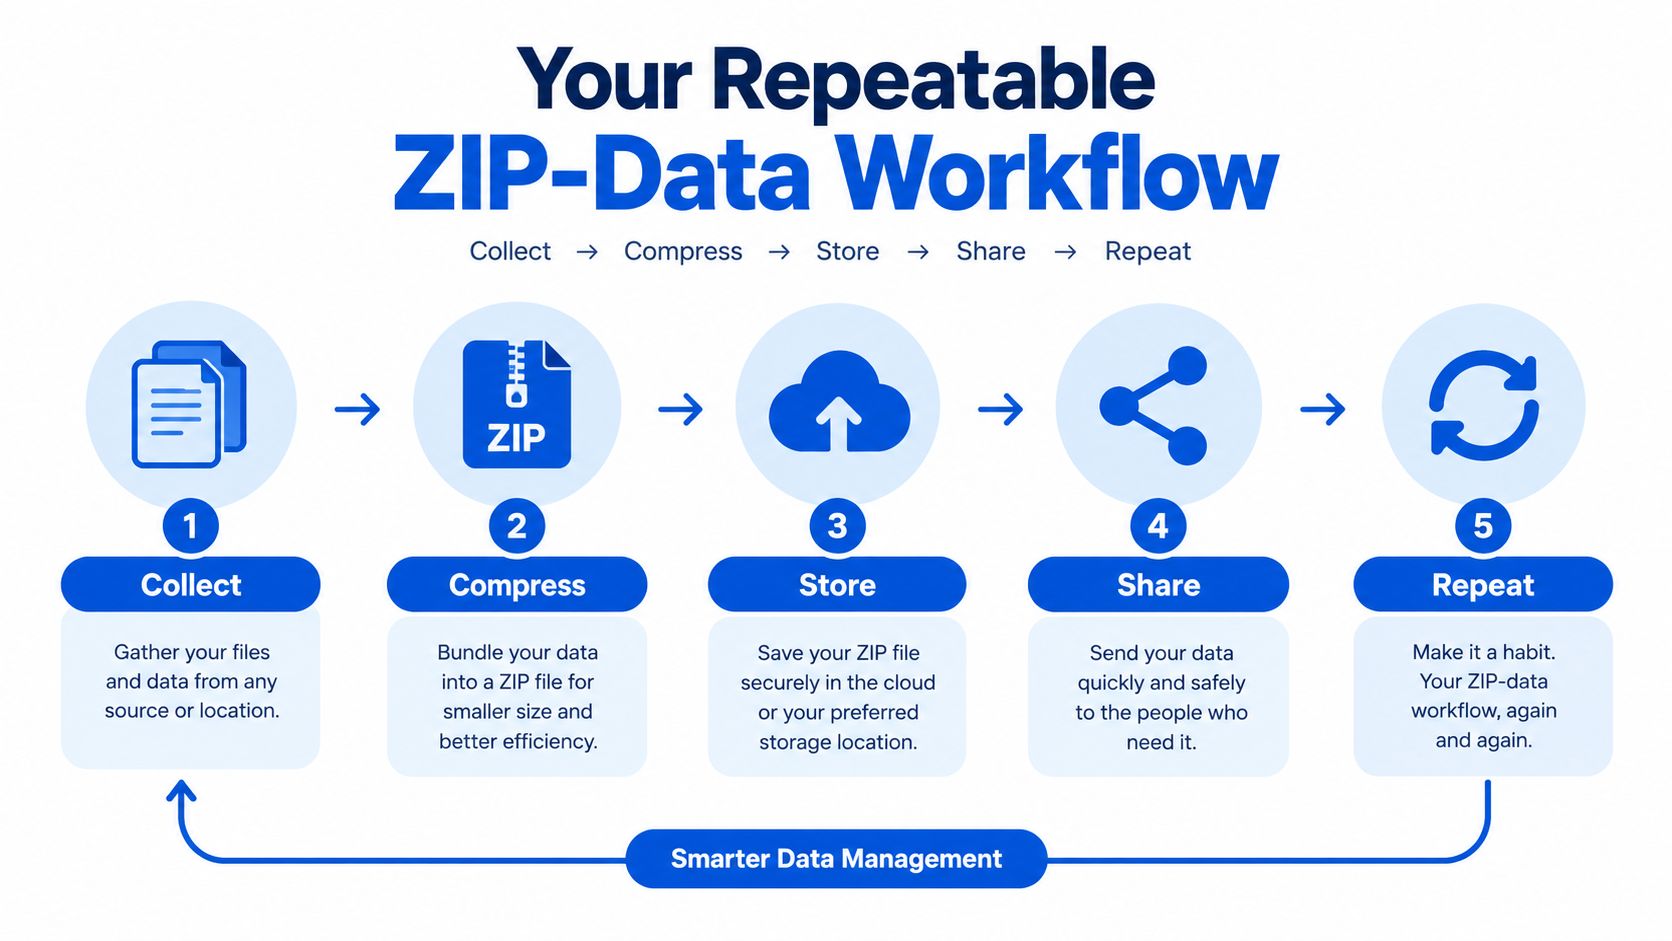
Your Repeatable ZIP-Data Workflow
A workable routine doesn't require constant manual research. Run a deeper demographic and housing-stock pull each quarter, then monitor rent and price direction more frequently. Use the Census ZCTA data for structural context, Zillow's indexed measures for market direction, and HUD SAFMR as an affordability anchor, while keeping current room comps and your own leasing data in the operating file.
Score every candidate ZIP against five filters:
- Rent growth direction, not just the current rent.
- Vacancy trend, including your own property performance.
- Absorption rate, or how quickly competing stock clears.
- Household income shift, as an affordability check.
- New supply pipeline, including rooms and conventional rentals.
Assign each property a tier such as defensive, stable, expansion, or watchlist. Tie the tier to practical rules for price tests, concessions, marketing spend, and renovation approval. A ZIP with improving demand and constrained supply may support a premium test, while a ZIP with rising inventory needs stronger conversion evidence before you increase rates.
Finish with a standing review. Reset property tiers, retire stale comps, record boundary changes, and write down which source first flagged the last meaningful move. That history turns scattered housing market data by ZIP code into an operating system your team can improve over time.
PadPulse brings rent-by-the-room operations, comparable-rent and demand intelligence, dynamic pricing workflows, communications, and portfolio reporting into one platform for co-living operators. If you want to turn ZIP-level market signals into faster pricing decisions and clearer occupancy planning, visit PadPulse and join the early interest list.