Unit Economics for Co-Living Operators Made Simple
September 2, 2026
A house can look busy, rent can arrive every month, and your bank balance can still hide a weak business. Many co-living hosts discover this after managing several properties: they know the portfolio's revenue, but they can't say what one room earns after vacancy, utilities, cleaning, repairs, marketing, and tenant turnover.
Unit economics solves that gap. It turns a property-level feeling into a room-level calculation you can repeat across houses, neighborhoods, and seasons. The key is choosing the right unit, measuring the revenue and variable costs attached to it, and then testing what happens when occupancy or pricing changes.
You don't need a finance background. You need a clear spreadsheet, honest inputs, and the willingness to follow one room's money from move-in to move-out.
Why Every Room-by-Room Operator Needs Unit Economics
A host I know once described three co-living houses as “solid performers.” The rooms were usually occupied, invoices went out on schedule, and the properties seemed to support themselves. But when asked what a single room contributed after utilities, vacancy, cleaning, repairs, and tenant acquisition, the answer was uncertain.
That uncertainty is expensive. A property can produce positive revenue while individual rooms underperform. One room may carry a high rent but sit empty between tenants. Another may have a lower rate but stay occupied, produce fewer service calls, and retain tenants longer.
Practical rule: If you can't explain the profit from one room, you're managing a property by impression rather than by evidence.
Room-level measurement also makes decisions easier. You can compare houses without letting one strong property hide another weak one. You can see whether a marketing channel fills rooms efficiently, whether a pricing change reduces vacancy, and whether turnover costs are consuming the margin you thought you had.
Your property-level profit and loss still matters. A guide to calculating net operating income helps connect room performance to the broader property result. But NOI becomes more useful when you understand which rooms and tenant cohorts created it.
The unit might be a room-month, a room-night, or a tenant-month, depending on the decision you're making. Once you define it, track revenue, direct variable costs, acquisition cost, retention, and payback consistently.
The same logic applies before a room enters your portfolio. If you're considering whether to decide who shares your home, you need more than a headline rent estimate. You need to understand how the room's occupants, operating requirements, and expected turnover affect the economics.
Understanding Unit Economics in Plain English
Think about a lemonade stand. The stand doesn't become profitable just because someone pays for a cup. You need to know the selling price, then subtract the lemons, sugar, ice, and cup used for that specific serving.
That is the basic idea behind unit economics. It measures the revenue and costs attached to one unit of business. A unit might be one customer, transaction, product, subscription, room-night, or tenant-month. The right choice depends on how your business earns and spends money. A neutral explanation of the framework defines CAC as sales and marketing spend divided by new customers acquired, and contribution margin as revenue minus variable costs in its unit economics guide.

For a room-by-room operator, choosing the unit requires care.
Choosing the unit that matches the question
Use a room-night when you're studying daily pricing, short vacancy gaps, or nightly operating costs. Use a tenant-month when you're evaluating recurring rent, utilities, retention, and the value of keeping a resident. Use a room-month when you want the most practical monthly operating view.
A property can also be a useful unit for mortgage, insurance, and maintenance planning. A portfolio slice can help an investor compare a city, acquisition channel, or property type. But those broader units shouldn't replace the room-level view when your rooms have different rates, occupancy histories, or service needs.
Fixed and variable costs must also stay separate. Fixed costs don't change with output in the short term, while variable costs rise as service volume increases, as explained in this overview of fixed and variable operating costs. Utilities tied to occupancy, payment processing, turnover cleaning, and certain supplies may vary with room use. Rent, insurance, and some management costs may remain fixed over the relevant period.
Contribution margin subtracts variable costs from room revenue. It doesn't subtract every overhead item. For a deeper look at allocating shared expenses, use this overhead rate calculation guide.
The Core Metrics and Formulas You Need to Track
You don't need a dashboard full of dozens of indicators. Start with a small set that answers four questions: how much can the room earn, what does each occupied room contribute, how much does it cost to fill, and how long does a tenant stay?
Revenue and room contribution
- RevPAU: Total room revenue ÷ total available room capacity. For a monthly room model, divide revenue by the rooms available during that month. It captures both rate and vacancy, so it's more informative than occupied-room rent alone.
- Contribution margin: Room revenue minus direct variable costs. If a room produces $1,000 and its occupancy-linked costs are $180, the contribution margin is $820 before fixed overhead.
- Contribution margin percentage: Contribution margin ÷ room revenue. This shows how much of each revenue dollar remains after direct variable costs, although the dollar contribution is usually more useful for payback planning.
RevPAU helps expose vacancy drag. A room that earns a high rate only when occupied may still generate less monthly revenue than a moderately priced room that fills more consistently.
Acquisition and retention
- Customer acquisition cost: Total sales and marketing spend ÷ new tenants acquired. If you spend $600 on listings, ads, referral fees, and leasing labor to secure three tenants, CAC is $200 per tenant.
- Churn: Tenants who leave during a period ÷ tenants at the start of that period. Co-living operators should usually examine churn in tenant-months, because residents leave individual rooms rather than annual software contracts.
- Average tenant lifetime: The typical length of a tenant's stay. Use actual move-in and move-out records, separated by property or tenant segment, rather than relying on a hopeful assumption.
- Lifetime value: Contribution margin per tenant-month × expected tenant lifetime in months. Using contribution margin instead of headline rent prevents LTV from overstating what a tenant contributes.
The two headline health checks
The LTV:CAC ratio is LTV ÷ CAC. The foundational benchmark is 3:1, meaning a business should generate at least three dollars of lifetime gross-profit value for each dollar spent acquiring a customer. Ratios below 2:1 are generally considered unsustainable. Recent B2B SaaS benchmark data reported a median ratio of 3.2:1, while 23% of SaaS companies reached the healthy 3:1 threshold and 31% operated below 2:1, according to 2026 CAC and LTV benchmarks.
CAC payback period asks how many months of contribution margin are needed to recover acquisition spend. Divide CAC by monthly contribution margin per tenant. A longer payback ties up cash, while a shorter one gives you more room to fund vacancies, repairs, and growth.
A Worked Example of Room-by-Room Unit Economics
Let's follow one fictional five-bedroom house for a month. Each room rents for $900 per month when occupied. Four rooms are occupied, and one remains vacant for the entire month.
The house collects $3,600 in rent. If you looked only at occupied rooms, the numbers might feel healthy. RevPAU tells a more complete story: $3,600 divided across five available rooms produces $720 per available room, not $900. The empty room created a monthly vacancy gap of $900.
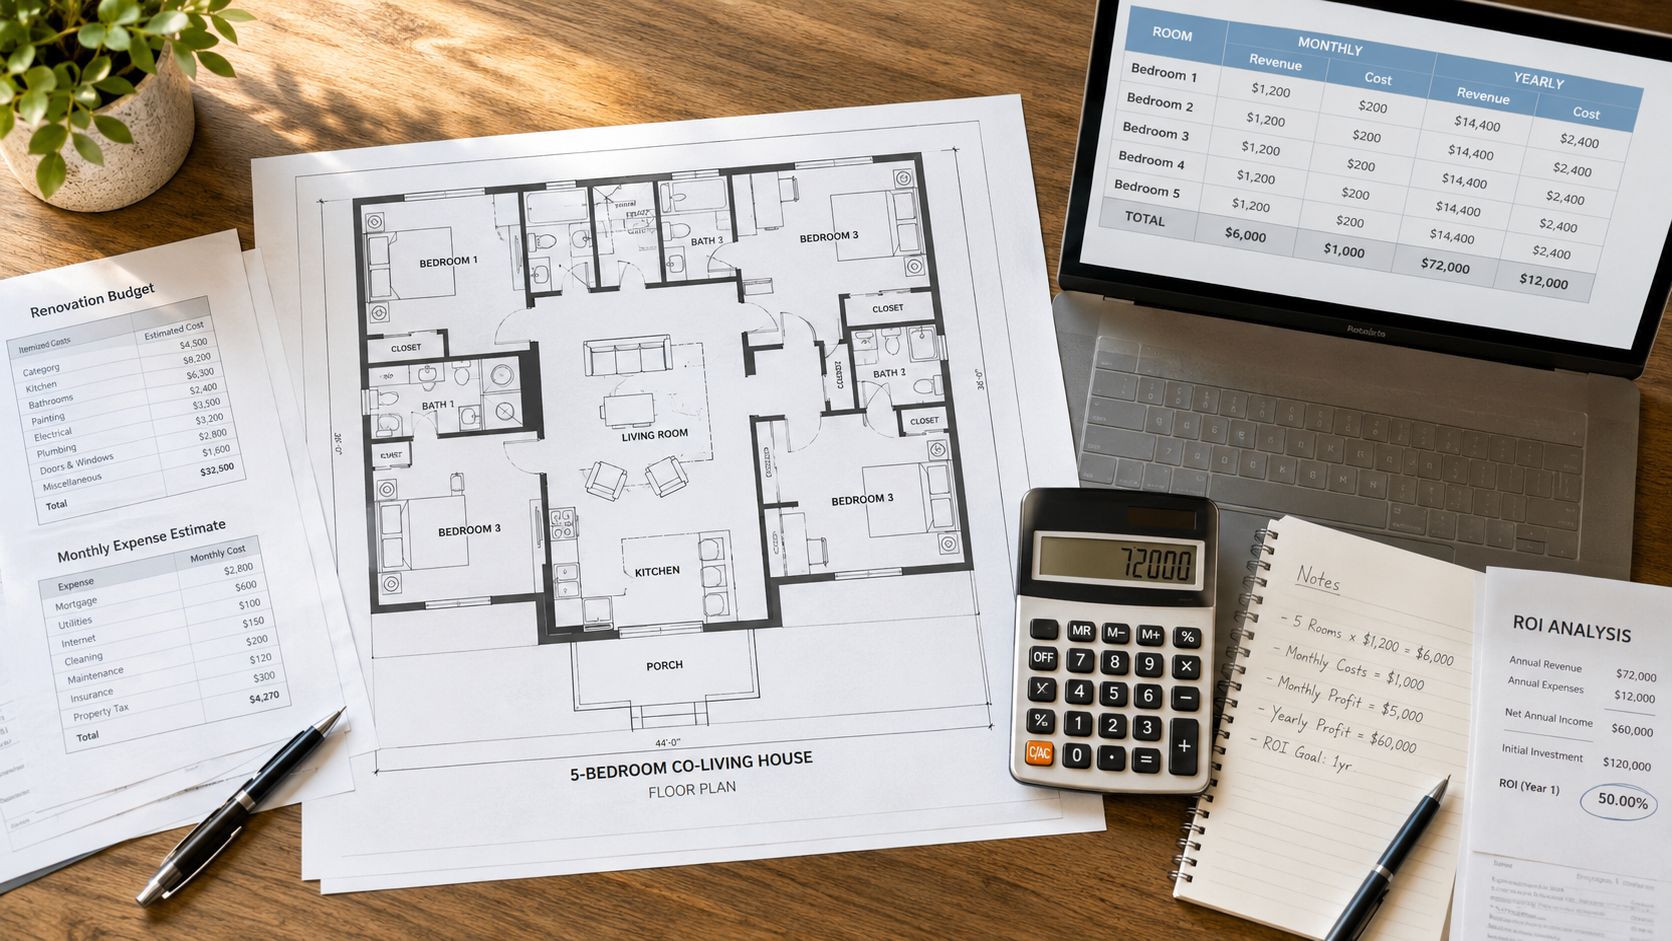
Assume each occupied room carries $180 in monthly variable costs for utilities, supplies, payment fees, and occupancy-related service. Four occupied rooms create $720 in variable costs. The house's monthly contribution margin is therefore $3,600 minus $720, or $2,880.
That equals $720 of contribution margin per occupied room, but the available-room view is different. Spread across all five rooms, the house contributes $576 per available room before fixed property costs. This distinction shows why occupied-room margin and available-room economics should sit beside each other.
For the tenant economics, suppose the operator spends $600 on listings, referrals, and leasing effort during the month and acquires three tenants. CAC is $200 per tenant. If the average tenant stays for eight months, and monthly contribution margin per tenant is $720, simple LTV is $5,760.
The resulting LTV:CAC ratio is 28.8:1 in this fictional example, calculated as $5,760 divided by $200. That ratio is unusually strong because the example uses a high monthly contribution margin and a low acquisition cost. Don't treat it as a target copied into your own model. Replace every assumption with your property's actual records.
The CAC payback period is $200 divided by $720, or less than one tenant-month. Your P&L report example can help you reconcile this room-level view with property-wide revenue and expenses.
Here's a short walkthrough of the same logic:
Build your spreadsheet with one row per room and columns for available days, occupied days, rent, variable costs, turnover costs, acquisition source, move-in date, and move-out date. Then calculate both occupied-room results and available-room results. The gap between them is often where vacancy decisions become visible.
Benchmarks and Sensitivity Analysis for Shared Housing
Software benchmarks can provide context, but they can't replace a co-living operator's own cost structure. Published 2026 B2B SaaS benchmarks reported average CAC of about $1,069 to $1,200, median LTV around $5,994, CAC payback of roughly 14 to 18 months, and commonly cited gross margins of 70% to 85%, as summarized in this unit economics benchmark review.
Those figures belong to recurring-revenue software models. A room has different costs, including utilities, cleaning, repairs, furnishing, compliance, and vacancy. Use the benchmarks as a vocabulary for financial health, not as a rent-by-room target.
Sensitivity analysis makes your model useful under changing conditions. Adjust one assumption at a time, then watch the contribution margin and payback period move. Test a softer occupancy month, a lower rate designed to fill a vacancy faster, higher utility usage, increased turnover, or a pricing change that affects churn.
| Scenario | Occupancy | Avg Room Rate | Contribution Margin per Room | CAC Payback |
|---|---|---|---|---|
| Optimistic | High | Higher | Stronger | Shorter |
| Base | Expected | Planned | Expected | Expected |
| Pessimistic | Lower | Discounted | Weaker | Longer |
The table intentionally uses qualitative inputs. Your own figures should reflect the property, season, and market you're evaluating. A price sensitivity analysis framework can help you organize the scenarios without confusing a rate change with a guaranteed profit improvement.
A lower room rate can be rational if the added occupancy produces more total contribution after vacancy, turnover, and acquisition costs.
Run the model before making the change. Compare the current rate and proposed rate using available-room revenue, contribution margin per available room, tenant churn, and time to fill. The winning price is the one that improves the full operating result, not necessarily the one with the highest rent on an occupied room.
Common Pitfalls That Quietly Destroy Your Margins
A high advertised rent doesn't prove a healthy room. It only proves what you hope to collect when the room is occupied and the tenant pays.
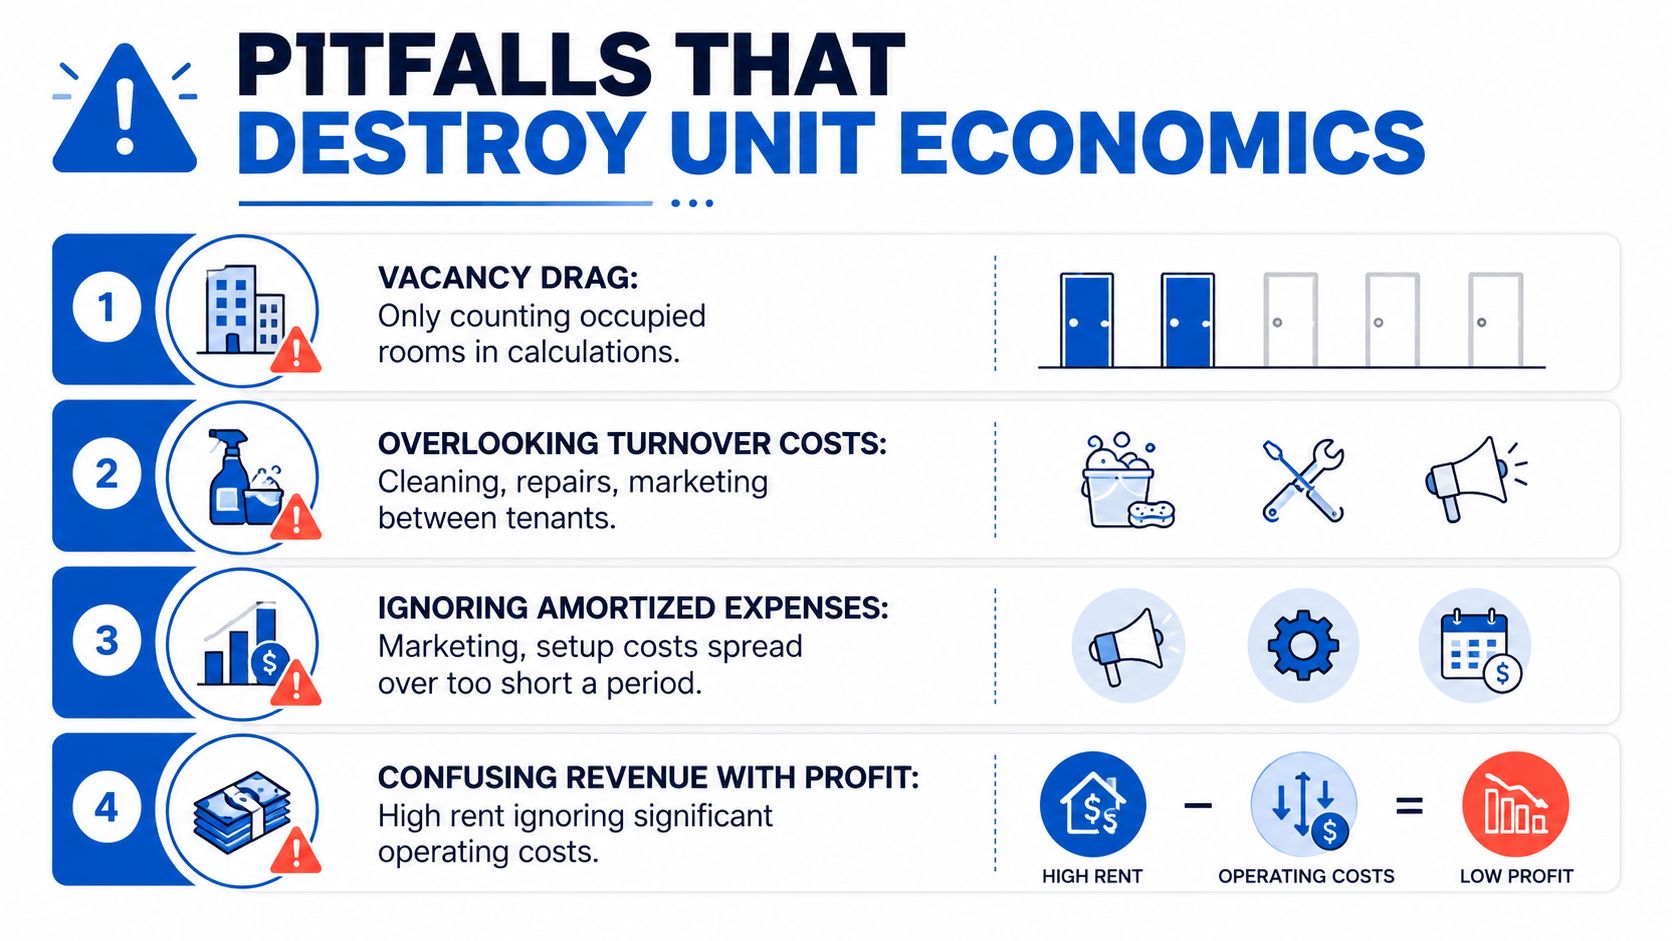
Use this audit list when your room-level numbers look better than your bank account:
- Vacancy drag: Count available rooms, not only occupied rooms. An empty room contributes no rent while the property may continue carrying its fixed costs.
- Cost classification errors: Don't subtract fixed overhead from contribution margin, but don't ignore it when deciding whether the property produces NOI. Keep the operating layers separate.
- Turnover leakage: Include cleaning, repairs, lock changes, marketing, staff time, and make-ready work between tenants. A room can look profitable monthly while losing much of its contribution during repeated turnover.
- Bad debt: Record late payments, payment failures, concessions, and uncollected balances. Contracted rent isn't the same as collected revenue.
- Short amortization windows: Spread setup and acquisition costs across a realistic tenant lifetime. Charging the entire cost against a single month can make one period look terrible, while ignoring it entirely makes the model falsely attractive.
Dynamic pricing creates another blind spot. Many operators treat rate, occupancy, and service cost as independent inputs, but they can move together. A lower rate may fill a room sooner, reduce vacancy drag, and prevent a long empty period. A higher rate may increase revenue per occupied room while extending time to fill or encouraging more price-sensitive tenants to leave.
The strongest economics don't always come from the highest headline rent. They may come from a balanced rate that supports stable occupancy, fewer move-outs, lower bad debt, and less make-ready work.
Practical Strategies to Improve Your Unit Economics
Improvement starts with the line item that is weak. If rooms sit empty, focus on fill speed. If tenants leave quickly, focus on screening, expectations, and communication. If occupied rooms produce little contribution, examine variable costs and pricing.
Adjust price for total room performance
Set a rate, then measure more than rent per occupied room. Track RevPAU, days vacant, contribution margin per available room, and CAC by acquisition channel.
A lower rate can improve NOI when it fills a room sooner and reduces vacancy drag. Test this with a controlled comparison in your spreadsheet. Estimate the lost rent per occupied month, then add the expected occupancy benefit and subtract any extra service or turnover cost. Don't approve a discount because it feels busy. Approve it when the full room-level result improves.
Protect occupancy and retention
Reduce time to fill by answering inquiries promptly, keeping photos accurate, and making move-in requirements easy to understand. Better tenant screening can also protect retention by matching residents with the property's rules, amenities, and shared-living expectations.
Measure the result through vacancy days, churn by property, average tenant lifetime, and LTV. If occupancy rises but churn also rises, the strategy may be filling rooms with poor-fit tenants rather than improving the unit.
Add revenue without adding avoidable work
Consider clearly communicated add-ons such as utility pass-throughs, late-payment fees where permitted, storage, parking, or optional services. Each add-on should have its own revenue and variable-cost row.
The question isn't whether an add-on increases billed revenue. Check whether it improves contribution margin after administration, support, payment costs, and potential tenant friction.
Control recurring operating costs
Smart-home tools can reduce waste when operators monitor them carefully. Keyless locks may simplify access and turnover, while thermostat monitoring can help identify unusual usage or vacant-room HVAC problems.
Track utility cost per occupied room, maintenance requests, turnover cost, and contribution margin before and after an operational change. Keep compliance, privacy, and tenant communication in the model. A cheaper system that creates service problems isn't a real improvement.
Your Takeaway on Room-Level Profitability
Unit economics gives you a practical answer to a question property-level revenue can't answer: What does one room contribute after the costs directly connected to earning and keeping its rent?
Start by defining the unit. For most room-by-room operators, a room-month is a useful operating unit, while room-night and tenant-month views answer more specific pricing and retention questions. Then track RevPAU, contribution margin, CAC, churn, LTV, and CAC payback in a consistent monthly file.
Use the numbers as a connected system:
- Define availability: Count every room you could have rented during the period.
- Measure contribution: Subtract direct variable costs from room revenue.
- Connect acquisition to retention: Compare CAC with contribution-based LTV.
- Stress-test decisions: Model lower occupancy, changing rates, variable-cost spikes, and turnover.
- Review NOI: Bring room-level findings back into the property and portfolio view.
Market conditions, local regulation, affordability demand, and tenant-mix stability can change the result from one city to another. Shared housing may create value through steadier occupancy, lower turnover, and fewer bad-debt events, not solely through the highest possible room rate. Your model should reflect those operating realities.
Run this exercise on one house this week. Use actual rent collected, vacant days, utilities, cleaning, repairs, marketing spend, and tenant stays. Once the first property is clear, duplicate the structure across the rest of the portfolio. Tools such as PadPulse are being built to automate pricing, occupancy, and P&L visibility, but the operating judgment still starts with defining the right unit.
PadPulse is being built to help co-living operators manage dynamic pricing, occupancy, tenant communications, smart-home operations, and room-level financial visibility in one platform. Visit PadPulse to learn more and join the early interest list for updates and potential beta access.