Demand Elasticity Guide for Property Operators
August 31, 2026
Demand elasticity measures how much the number of people willing to rent a room changes when you change the price. In housing studies, short-run estimates have included -0.64 in Pittsburgh and -0.45 in Phoenix, so a price increase can reduce demand without reducing it proportionally.
You've probably felt the problem without having a name for it. You raise a room's rate because inquiries are strong, then vacancies begin to appear. Later, you cut the price to fill the room quickly and wonder whether the lower rent was necessary. The money lost in both situations doesn't always show up in a single obvious line item. It appears through longer vacancy periods, weaker renewals, rushed discounts, and lower net operating income.
Demand elasticity gives you a practical way to understand those outcomes. It measures how sensitive renters are to a price change, which makes it useful for setting room rates, evaluating promotions, planning renewals, and deciding when a dynamic pricing adjustment has gone too far. The aim isn't to predict every renter perfectly. It's to replace instinct alone with a clearer view of how your market responds.
Why Room Pricing Decisions Feel Like Guesswork
A four-bedroom house has one room open. The other rooms are occupied, inquiries have been steady, and comparable listings appear slightly higher than your current rate. You increase the available room's price, expecting the extra revenue to outweigh any slower leasing activity. Instead, prospects stop responding, the room sits empty, and the higher advertised rate produces no additional income.
The opposite mistake hurts just as much. An operator sees a vacancy and immediately drops the price. The room rents quickly, but later conversations reveal that several prospects would have accepted the original rate. The operator filled the room, yet gave away pricing power that the market may have supported.
Operator's lesson: A filled room isn't automatically a profitable room, and a higher advertised rate isn't automatically a better price.
The missing question is simple: How much does demand change when price changes? Demand elasticity provides the answer in proportional terms. If renters have few realistic alternatives, a rate increase may cause only a modest response. If several comparable rooms are available nearby, or if the renter can delay the move, the same increase may produce a much larger fall in inquiries.
That sensitivity can change by property, neighborhood, renter segment, season, lease stage, and availability of substitutes. A private room near a major employment center may attract renters who value location and convenience. A similar room in a crowded market may compete mainly on price.
You'll use this lens across the entire rental cycle:
- Initial pricing: Estimate whether your asking rate leaves room to capture more revenue.
- Vacancy management: Decide whether a discount is likely to improve leasing speed enough to justify lower rent.
- Renewals: Separate temporary tenant acceptance from lasting willingness to pay.
- Promotions: Check whether a response reflects genuine price sensitivity or urgency created by the offer.
Operators who want to compare broader planning options can also view PropLab plan options when evaluating tools for property analysis. The important principle remains the same: pricing should be a measured operating decision, not a reaction to one quiet day or one enthusiastic inquiry.
What Demand Elasticity Actually Means
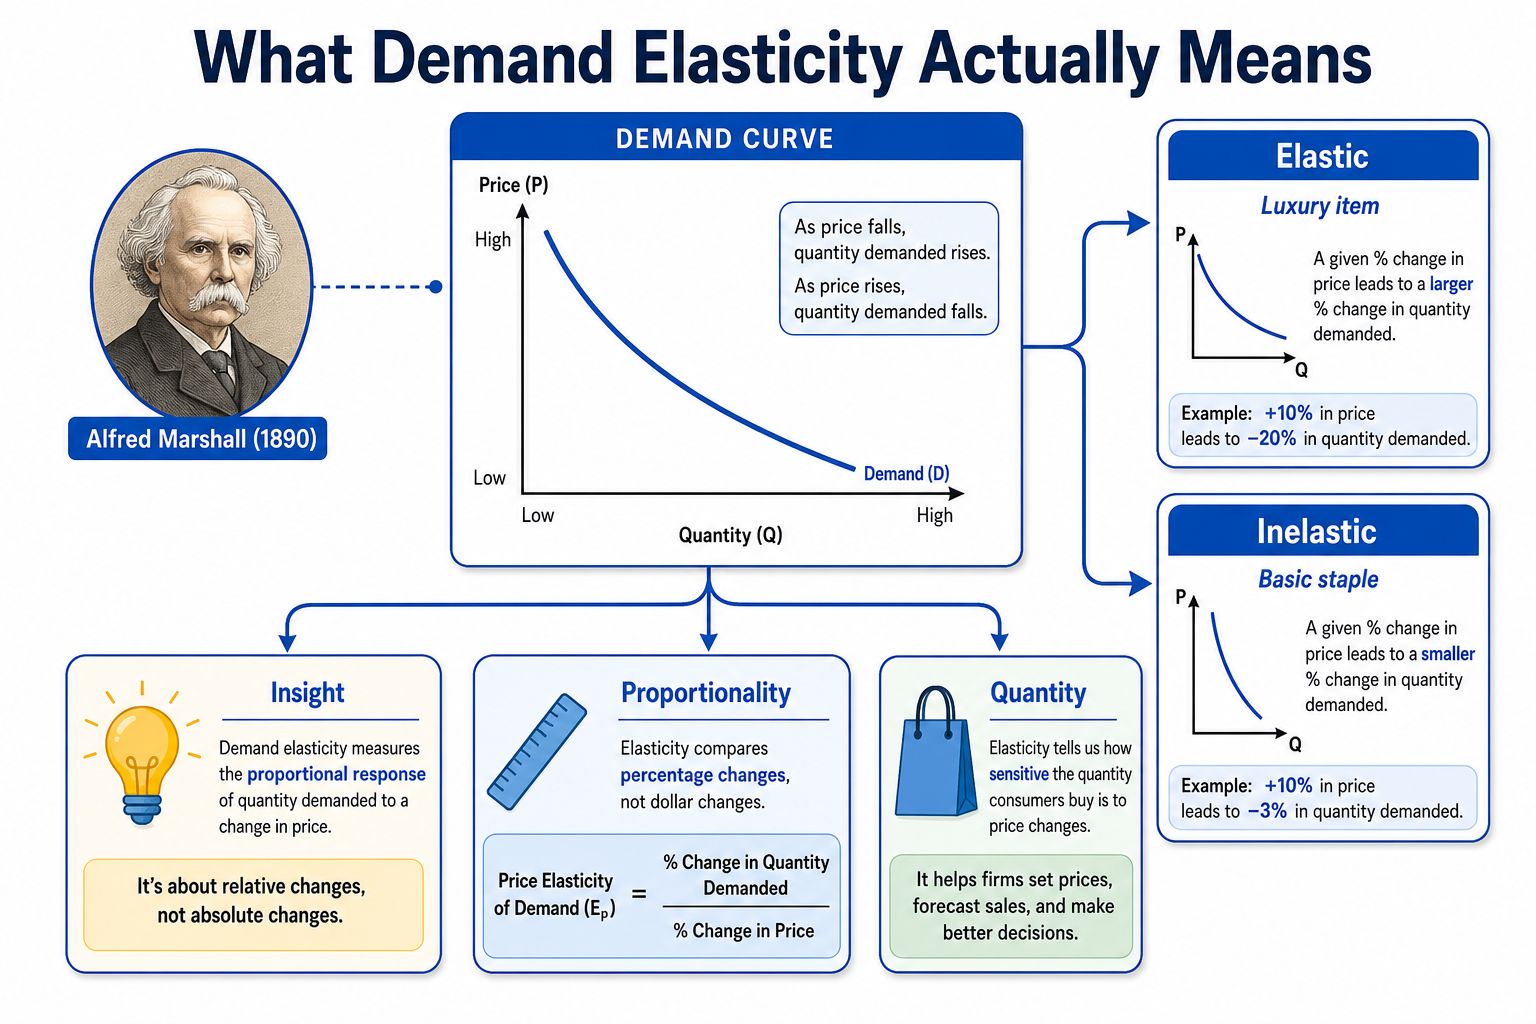
Economist Alfred Marshall formalized price elasticity of demand in 1890 in Principles of Economics. Historical accounts also trace earlier elasticity ideas to demand discussions from 1627, mathematical work by Whewell in 1829 and 1831, and contributions from Cournot, Dupuit, and others during 1838 to 1844. The history matters because the concept was built to describe a practical behavior, how buyers respond when prices move, not to create an abstract score for economists. (Historical account of demand elasticity)
The standard formula is:
Demand elasticity = percentage change in quantity demanded ÷ percentage change in price
For a room operator, “quantity demanded” can mean the number of qualified inquiries, applications, signed leases, or occupied rooms. Pick one measure and use it consistently. If you compare inquiries in one period with signed leases in another, the calculation mixes different stages of demand and becomes difficult to interpret.
A simple rental calculation
Suppose you raise a room rate by 10% and the number of qualified applications falls by 4%. The calculation is:
-4% ÷ 10% = -0.4
The negative sign reflects the usual relationship between price and demand. As price rises, demand tends to fall. Operators often focus on the magnitude, so 0.4 indicates that demand changed less than proportionally relative to price.
- Magnitude below 1: Demand is inelastic. Quantity responds less than price.
- Magnitude above 1: Demand is elastic. Quantity responds more than price.
- Magnitude equal to 1: Demand is unit elastic. Quantity and price change proportionally.
The formula doesn't tell you whether a price change is wise by itself. It tells you how strongly demand responds. You still need to consider operating costs, vacancy duration, tenant quality, turnover, and the reliability of your data.
A useful mental model is:
Price changes, renters respond, occupancy and revenue follow.
If the renter response is small, raising price may increase revenue. If the response is large, the higher rate may be offset by vacancy. The same percentage price change can produce different outcomes across properties because elasticity depends on substitutes, income, preferences, the duration of the change, and the share of the household budget represented by the purchase. (Evidence on the definition and context dependence of elasticity)
Interpreting Elasticity Numbers for Rental Markets
A room sits vacant after a rate increase, even though similar rooms nearby are filling. The right question is not whether the new price is “too high” in general. It is how strongly this room's renters respond when its price changes.
Inelastic demand
When the elasticity magnitude is below 1, demand changes less than proportionally. A moderate increase may therefore reduce inquiries by less than the rate increase, particularly when the room has a scarce location, dependable amenities, flexible terms, or few alternatives.
Housing research offers useful reference points. One study estimated short-run housing-demand elasticity at approximately -0.64 in Pittsburgh and -0.45 in Phoenix. In those samples, a 10% price increase corresponded to estimated demand reductions of roughly 6.4% and 4.5%, respectively. (NBER housing-demand estimates)
For an operator, that relationship can support a higher rate, provided the listing is monitored. A room with inelastic demand can still lose qualified renters when competing listings improve or local incomes weaken. Track inquiries, applications, showing attendance, and vacancy days rather than treating the coefficient as a permanent property label.
Elastic demand
When the magnitude exceeds 1, renters respond more than proportionally. A small increase can produce a larger fall in applications or occupancy when renters can compare similar rooms quickly, switch easily, or delay moving.
The documented examples show how widely responses can differ: estimated elasticity is about -0.04 for gasoline, -0.31 for sugar, -1.20 for tires, and -3.70 for movies. With an elasticity of -0.04, a 1% price increase is associated with about a 0.04% demand decline for gasoline. With an elasticity of -3.70, movies see about a 3.7% decline. (Empirical elasticity examples)
Room rentals can shift categories as conditions change. A furnished room near transit may face less price sensitivity than a basic room competing with many near-identical listings. Review vacancy patterns and inquiry quality before applying an estimate from another city.
For market context, operators can consult World Property Investor's vacancy information. Vacancy data cannot calculate a property's elasticity, but it can indicate whether local conditions appear tight or competitive. PadPulse pricing adjustments become more useful when this market context is combined with your own room-level results.
Worked Examples for Room-by-Room Pricing
A room priced at $700 may appear successful until applications slow after a rate change. The formula becomes useful when you apply it to records you already keep. Compare similar periods, use the same demand measure, and note promotions, listing changes, or availability differences that could affect the result.
Example one, estimate elasticity from observed results
A four-bedroom property has three occupied rooms and one vacancy. The operator raises the vacant room's advertised rate from $700 to $770, a 10% increase. During the comparison period, qualified applications for comparable available rooms fall from 25 to 24, a 4% decrease.
Calculate the price change.
($770 - $700) ÷ ($700) = 10%.Calculate the demand change.
((24 - 25) ÷ 25) = -4%.Divide demand change by price change.
-4% ÷ 10% = -0.4.
The estimated elasticity magnitude is 0.4, indicating inelastic demand in this observed comparison. That result applies to this set of conditions, not automatically to every future adjustment. Check whether competing rooms changed price, the listing lost visibility, or the room differed from those in the comparison period.
Example two, project a response before changing price
Assume your estimated elasticity is -0.45, using the Phoenix housing estimate as a reference rather than a replacement for your property's own records. You are considering a 10% rent increase on a room currently priced at $700.
Estimate the quantity response.
-0.45 × 10% = -4.5%.Translate the response into an occupancy index.
If starting occupancy equals 100 units, the projected level becomes 95.5 units after the estimated response.Compare price and quantity directionally.
Price rises by 10%, while projected demand falls by 4.5%. Revenue could increase because quantity declines less than price, although vacancy timing and the number of affected rooms still matter.
| Example | Price Change | Occupancy Response | Elasticity Value | Revenue Impact |
|---|---|---|---|---|
| Observed room comparison | 10% increase | 4% decrease in applications | -0.4 | Potentially positive if the demand measure remains comparable |
| Planning estimate | 10% increase | 4.5% projected decrease | -0.45 | Directionally positive before vacancy and turnover costs |
For a practical method of comparing renter responses across pricing changes, review this price sensitivity analysis guide.
Avoid three common errors:
- Using absolute changes: A $70 increase does not measure the same thing as a 10% increase.
- Ignoring the negative sign: The negative sign indicates direction while the magnitude indicates sensitivity.
- Treating one observation as permanent: A single vacancy or lease cannot establish a stable market coefficient. Use room-level results to refine PadPulse pricing adjustments over time.
Short Run versus Long Run Dynamics
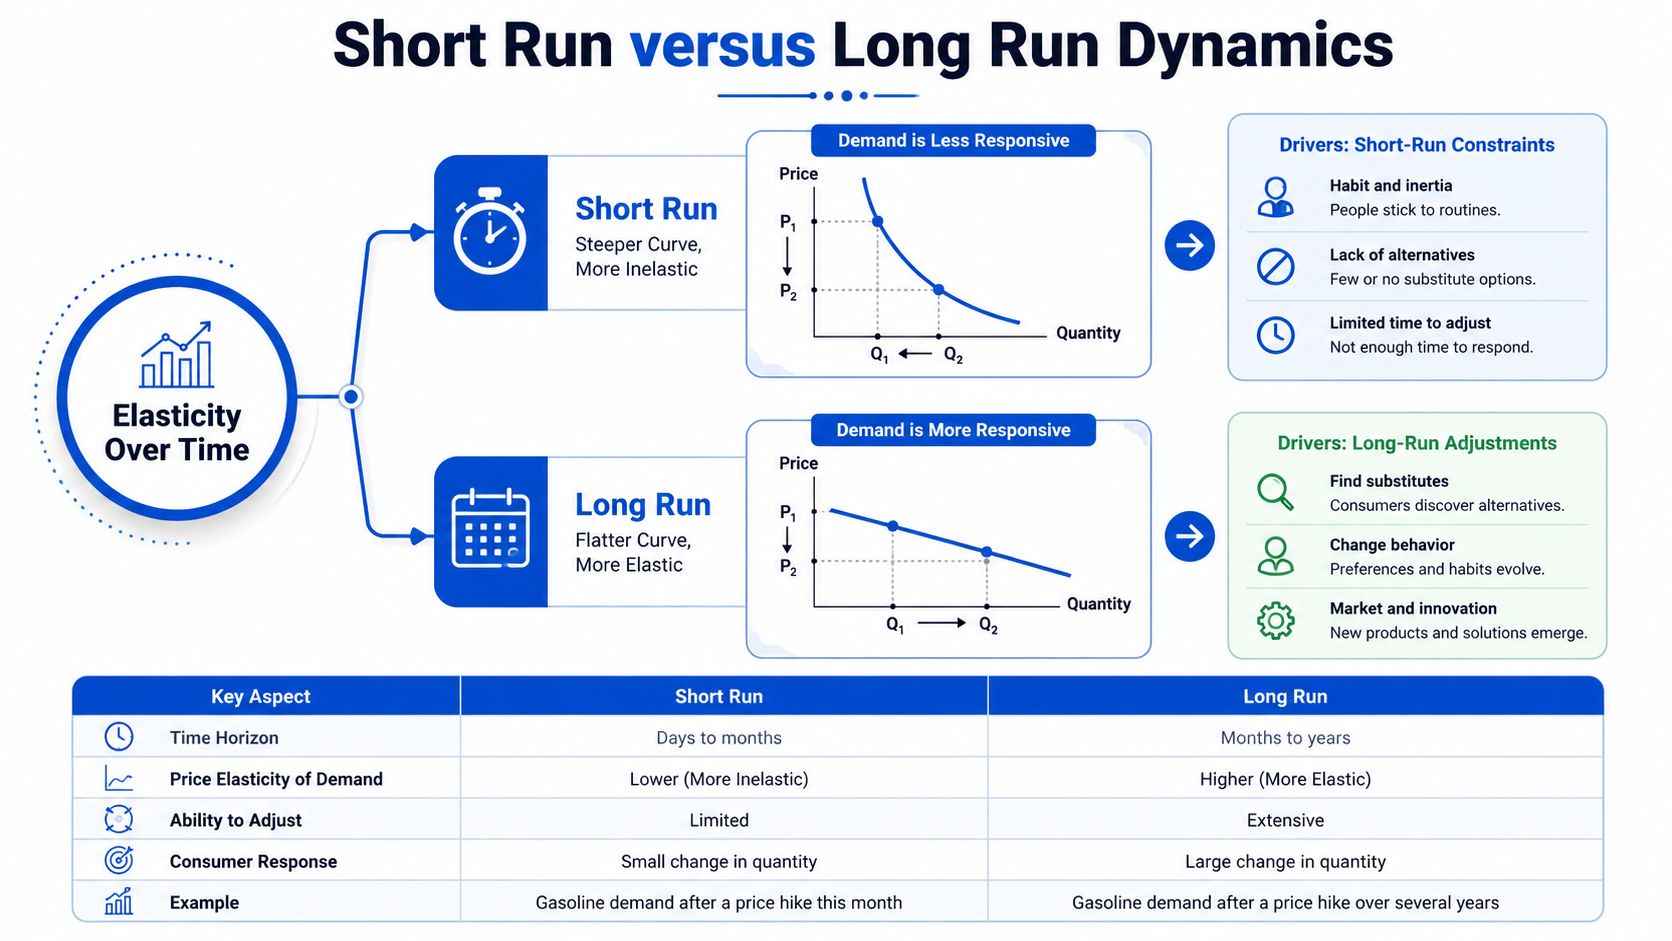
A renter may accept a price increase today because moving takes effort, alternatives aren't immediately available, or the lease hasn't reached renewal. That short-term behavior can make a price change look safer than it really is. Over time, renters search, compare, adjust budgets, and choose substitutes.
A time-series application using monthly data from Seville, Spain, estimated short-run price elasticity near -0.1 and long-run elasticity around -0.5. A 10% price increase initially reduced demand by about 1%, while the longer-run effect reached roughly 5%. (Seville elasticity study)
What the timing means for room operators
A short-run occupancy snapshot answers only part of the question. Track the delayed signals that reveal whether renters have adapted:
- New inquiries: Are prospects still contacting you at the same rate?
- Application progression: Are qualified leads abandoning before approval?
- Renewals: Do current renters accept the new rate when they have time to consider alternatives?
- Vacancy duration: Does the room take longer to fill after a move-out?
- Turnover cost: Does the rate change create cleaning, repair, or marketing costs?
Practical rule: Don't judge a pricing experiment only by the first response. Match the review period to the lease decision you're trying to influence.
Dynamic pricing works best when it respects this timeline. Frequent adjustments can capture changing demand, but rapid changes can also create noisy observations. Record the date, price, availability, lead volume, and lease outcome so you can distinguish a genuine response from a temporary fluctuation.
A demand forecasting framework can help operators organize those signals before making another rate decision. The objective isn't to chase every movement. It's to identify whether renters are absorbing the change, switching later, or leaving at renewal.
The central distinction is simple. Short-run inelasticity can protect today's occupancy. Long-run elasticity can determine tomorrow's vacancy and renewal performance.
Turning Elasticity Insights into Action with PadPulse
Demand elasticity becomes useful when it changes what you do with your next pricing cycle. Start with your own records rather than searching for a universal housing coefficient. A published estimate can provide context, but your property's renter mix, location, room quality, lease terms, and competitive set shape the response you will observe.
Build a dependable local estimate
Keep a simple history for every room:
- Price history: Record the advertised and signed rate, including discounts.
- Demand stage: Separate views, inquiries, applications, approvals, and signed leases.
- Availability: Note whether the room was open, occupied, pending, or temporarily unavailable.
- Market context: Record meaningful changes in comparable room rates and property condition.
- Timing: Mark renewals separately from new leases because renters face different choices.
Calculate elasticity only across comparable observations. If you change the room's furnishings, listing quality, lease flexibility, and price at the same time, you won't know which factor caused the demand response.
A 2025 theory paper warns that promotional timing and model choice can bias measured elasticity, while dynamic asset-pricing work suggests measured demand slopes may be only about 40% of their conceptual counterpart. Those findings support a cautious operating habit: treat estimates as signals that need validation, not as unquestionable facts. (Research on promotional-pricing and measurement bias)
Turn observations into operating rules
Set thresholds that prompt review rather than automatic action. For example, a sustained decline in qualified applications after a rate change deserves investigation. So does a rise in renewal resistance when new inquiries remain healthy.
Use a lightweight decision sequence:
- Check the data: Confirm that availability, listing exposure, and lead quality stayed comparable.
- Classify the response: Determine whether demand appears less than, equal to, or more than proportionally sensitive.
- Review the horizon: Separate immediate occupancy from later renewals and vacancy duration.
- Choose the smallest useful adjustment: Avoid changing multiple variables at once.
- Record the outcome: Preserve the result for the next pricing decision.
Segment the analysis whenever your market contains different renter groups. New evidence in higher education estimated postgraduate application elasticity at -0.27 and enrolment elasticity at -0.13, while undergraduate demand was largely inelastic. The broader lesson applies to housing: people in different life stages, income conditions, and locations can respond differently to the same price. (Evidence on segment-specific elasticity)
That's why a single portfolio-wide rule can misprice individual rooms. A property management system such as PadPulse can support a more systematic workflow by bringing room rates, occupancy, messaging, financial visibility, and market comparisons into one operating view. Its planned dynamic pricing approach is most valuable when you use it alongside documented assumptions and human review, not as a replacement for judgment.
For additional market context, review competitive pricing intelligence and compare your room's position with comparable listings. Don't compare a basic room with a renovated private suite and call the difference elasticity.
Your implementation priorities should follow impact:
- First, standardize the records. Consistent price and demand definitions prevent misleading calculations.
- Next, segment the property. Separate rooms by location, finish, amenities, and renter profile.
- Then, monitor horizons. Review immediate inquiries, upcoming renewals, and later vacancy patterns.
- Finally, automate carefully. Let dynamic pricing surface opportunities, while thresholds and review notes prevent overreaction.
Elasticity isn't a one-time calculation. Each pricing cycle gives you another observation, and each clean observation makes the next decision more informed. You don't need perfect forecasting. You need a repeatable process that protects occupancy while testing how much renters are willing to pay.
PadPulse brings room-by-room operators dynamic pricing, inquiry workflows, market intelligence, and financial visibility in one platform. Visit PadPulse to follow the product and join the early-access interest list, then use your own pricing and occupancy history to make the next rate change deliberately.